Writing in the Wall Street Journal last May, the Manhattan Institute’s Heather Mac Donald blackly heralded a “new nationwide crime wave.” She blamed the “Ferguson effect”: a pull-back by police in the face of public hostility over alleged abuses. Ferguson, of course, is the city in St. Louis county where in August 2014, a police officer shot and killed Michael Brown, leading to days of rioting.
Toward the end of last summer, two reporters at the New York Times chimed in on the existence of an uptick, at least in homicide: “Murder Rates Rising Sharply in Many U.S. Cities.”
These suggestions of an incipient crime wave caught Open Phil’s attention because we are entering the field of criminal justice reform. Might attempts to curb the “tough-on-crime” approach that has made the United States the world’s greatest prison state backfire in the form of higher crime? Or if not, might fear of such obstruct reform?
As the crime wave meme spread, it provoked counter reactions: Joseph Margulies on “The Dangerous Notion of a Nationwide Crime Wave“; Richard Rosenfeld of St. Louis University questioning whether even St. Louis felt the Ferguson effect; FiveThirtyEight’s Carl Bialik on how “Scare Headlines Exaggerated The U.S. Crime Wave“; a Brennan Center report and a New York Times editorial it inspired; and end-of-year updates by Radley Balko for the Washington Post and Thomas Abt for the Marshall Project.
Here, I present my attempt, with the help of GiveWell’s Jake Marcus, to sort out the controversy of whether America is experiencing a crime wave. Our results are all graphical. Our analysis is distinctive in starting from daily data rather than monthly or yearly totals, which I find a bit coarse when examining trends over just the last year or so.
But, as with the other articles and posts, our numbers are not definitive. We obtained high-frequency data—lists of individual crimes—for 19 major municipalities. The statistics pertain only to territories within city limits, not to broader metropolitan areas. Even if they did, the sampled cities may not be representative of all cities, let alone the entire United States.
Nevertheless, the results look reasonable and interesting. In our sample, the murder rate does rise starting around January 2014. But this fluctuation so far looks small compared to the big, overall slide since 2001, and is commensurate with past, temporary reversals. And it may have peaked a few months ago. (You heard it here first.) Meanwhile, totals for the broader category of violent crime, in which the rare offense of homicide hardly figures, rose only slightly, even as property crime kept dropping. These splits across crime types are the opposite of what I would expect from a Ferguson effect. Seemingly, more than with crimes of passion, theft and burglary begin with rational consideration of risk factors such as whether the police are around. But they kept falling.
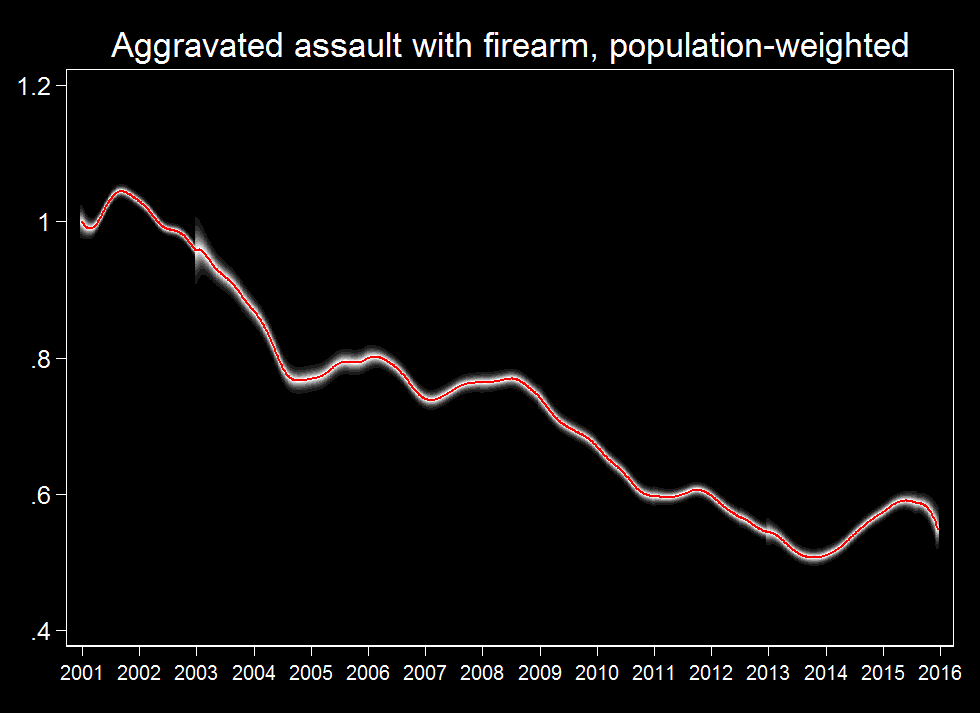
Zeroing in on the conceptual boundary within violent crime between homicide and everything else, we find that the crime subtype most resembling murder—armed assault—also appears to have ticked upward, especially if we restrict to assault with a firearm. It may be then the recent crime wave is best seen as a gun crime wave. We are not certain, in part because data limitations force us to base that finding on just nine cities. And, in an even smaller sample, non-gun homicides have recently climbed faster than gun homicides.
As the FBI gathers comprehensive statistics this year, the reality of last year will become clearer.
For now, Jake and I took advantage of a welcome trend: more and more cities are posting administrative information on public data portals. For example, here with a few clicks you can download a gigabyte file of all reported crimes in Chicago, from January 1, 2001, to approximately yesterday. (You can also get data on everything from problem landlords to food inspections.) By contrast, New York is behind the times on transparency. It only posts a few crime tables with annual totals more suitable for perusal by humans than processing by apps or statistical software. For some cities, we also found unofficial, homicide-only data (e.g., Oakland, Los Angeles, Washington).
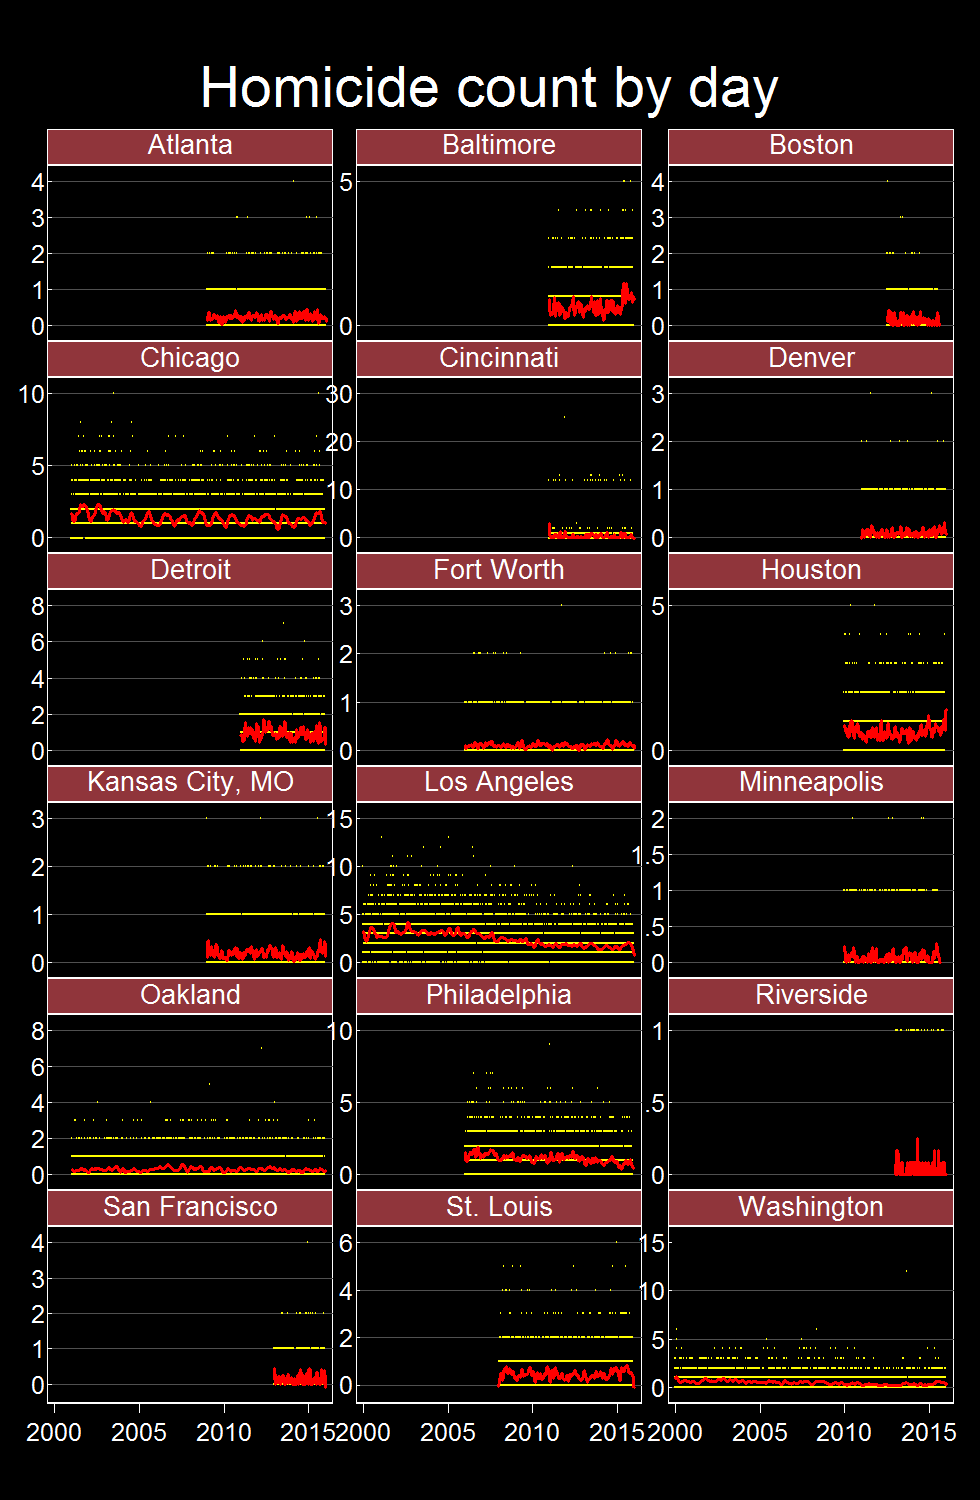
This fine-grained data allows us to plot daily rates of crimes in various categories. So we did our best to gather it for major cities. We ended up finding some information for 19 of the 70 largest municipal areas in the US. As an example, these graphs shows the number of homicides by day and city, with yellow dots. Superimposed are smoother moving averages in red. (Click the image for a larger version.)
Although the time axes all start in January 2000, few cities have posted data going back that far. Since our goal was to blend the cities’ data into a composite trend, we needed to carefully handle the differences in coverage lest we create spurious jumps. For example, if we just computed the average murder rate for each day, for all cities with data that day, then the average would plunge on January 1, 2010, when Minneapolis, a low-murder city, enters the sample. We address this problem by computing the exact jump produced each time a city enters or exits the data and then shifting the averages on that and all later days upward or downward to remove it. (Despite this fix, for technical reasons the error bands sharply widen when new cities enter.)
The price of this splicing is some abstractness in meaning. The composite trend we construct is not the trend that any one city experienced, nor even the combined trend for all the cities, since which cities contribute to it varies over time. But it does show, week by week, how urban crime moved overall, while making maximum use of available data.
(A few more details: The counts for Seattle plunge rather suddenly in the autumn of 2014 for property crime and some other categories, suggesting major changes or problems in data collection. So we dropped Seattle. For Oakland, Los Angeles, and Washington, DC, we only have homicide data. This leaves us with 18 cities for homicide and 15 for other broad crime categories. All but two carry at least into last December. Exceptions: Boston drops out on August 11, 2015, and Minneapolis on September 4. We adjust for population growth in each city. Separately, we average across cities, in two ways: simple averaging, in which big cities such as Los Angeles count as much as smaller ones such Cincinnati; and weighting by population, which is what I show here. This document describes the math more precisely. Code and data are here.)
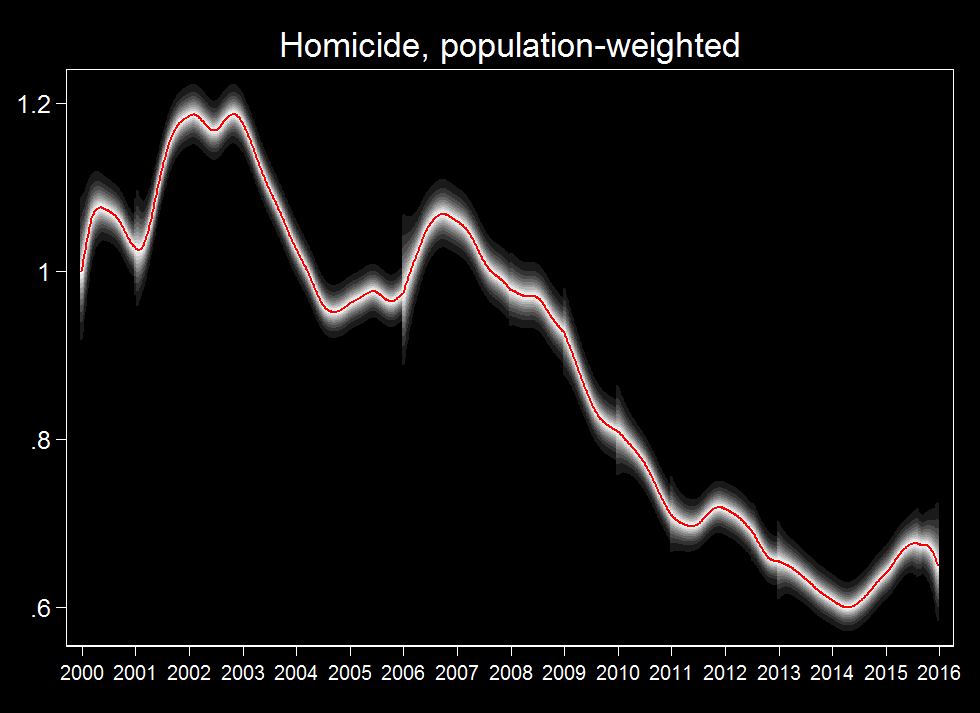
Here is the composite trend for homicide. Since, as just explained, its units are abstract, I scale it so that the starting value is 1.0. The red line shows the estimated trend and the grey bands show confidence intervals out to 95%. (Again, click for a larger version.)
We see that the urban murder rate has mostly fallen since 2000, that it has transiently reversed course a few times, and that it indeed has done so again recently. (What drives homicide trends ain’t exactly clear, but see Vox’s review of theories.)
Now, each point on the red line is a centered average of surrounding data, giving the most weight to homicide counts in the few months just before and after. Since the red line starts to rise in April 2014, that points to an increase in the raw data a few months later, which is indeed when Ferguson hit the headlines. However, this rise is so far not large by the standards of past ripples. And the data hint that it peaked last year; I say “hint” because the error bands for the last few months are wide. Averaging across cities without weighting by population tells the same story.
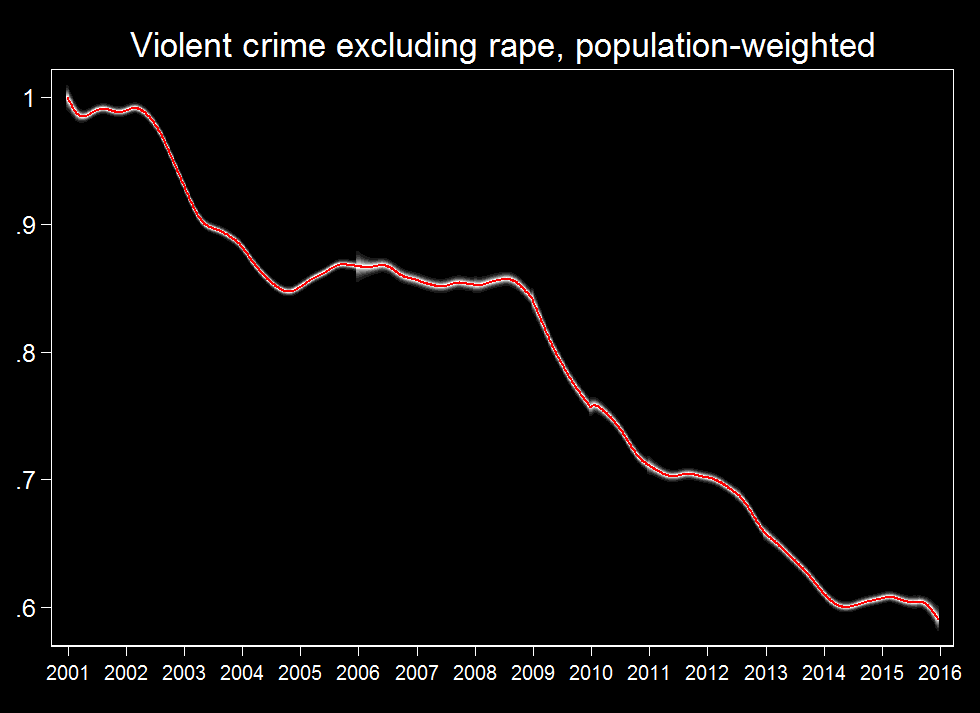
So there was at least a murder wavelet. What about crime more generally? In the FBI’s typology, homicide is one category of serious violent crime, the other three being rape, robbery, and aggravated assault. (Robbery is violent because it is forcible theft from a person. “Aggravated” means “intended to inflict severe bodily harm,” usually through use of a weapon.) We decided to check the trend in violent crime generally. But we excluded rape because the FBI broadened that category in 2013, potentially creating spurious statistical shifts. The violent crime trend we compute is dominated by aggravated assault and robbery, which accounted for 68.5% and 30.1% of non-rape violent crimes in 2014 nationwide.
It turns out that in our sample violent crime also rose starting in 2014. See the graph just below. But the increase is so slight relative to the historical decline that I think few people would summarize the graph that way. And this rise too appears to have peaked, and with more statistical certainty than with homicide.
(Because assault and robbery are far more common than homicide, their daily and weekly counts are more stable, making for less noise in the data. That’s why the grey error bands are narrower.)
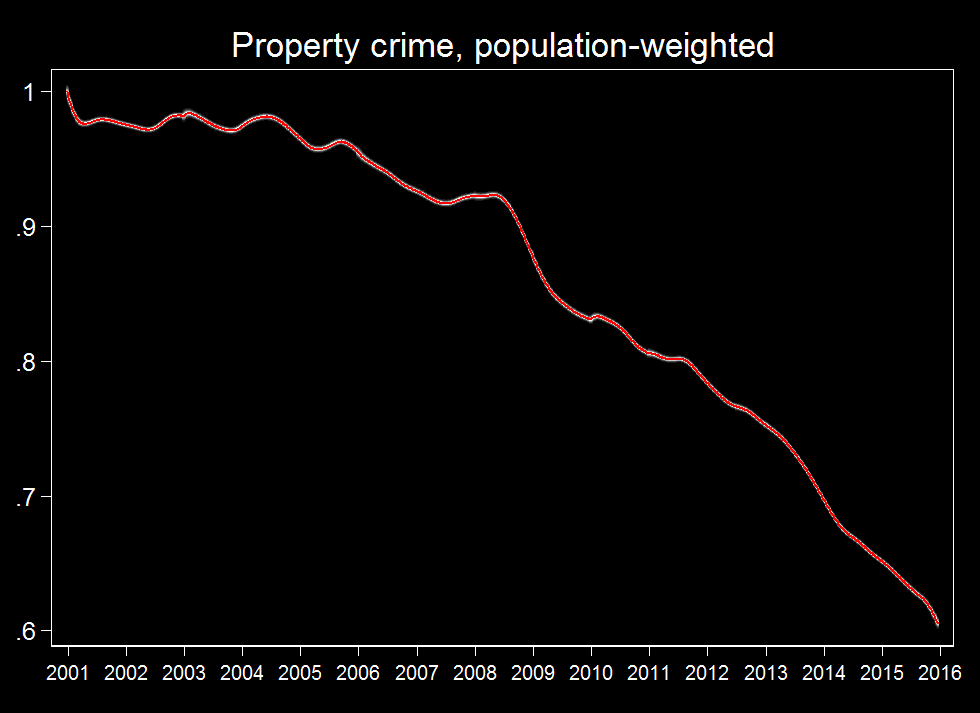
Meanwhile, property crime—burglary, arson, theft of motor vehicles and other belongings—kept falling:
It appears that Americans are steadily getting better at securing stuff—installing secure windows and burglar alarms, buying cars that are hard to steal.
The temporary nature of the recent pause in the violent crime decline does not quite put the lie to the “Ferguson effect.” Possibly it too was real, yet passing. Maybe the police pulled back and then returned. However, it seems harder to explain why the Ferguson effect would hardly touch property crime, which kept dropping like a stone. Criminologists tend to think of violent crimes as crimes of passion, while property crimes are executed with more forethought and rationality—in particular, more consideration of whether the police are around. So from the point of view of the Ferguson theory, the greater rise in less-rational crime looks backward. Maybe, my colleague Howie Lempel points out, a police pullback cut reporting of crime, especially the less serious kinds; after all, police are the ones who compile crime reports. The Department of Justice annually conducts a household survey on crime victimization, which will in time give us insight into the changes in 2015 while bypassing police data.
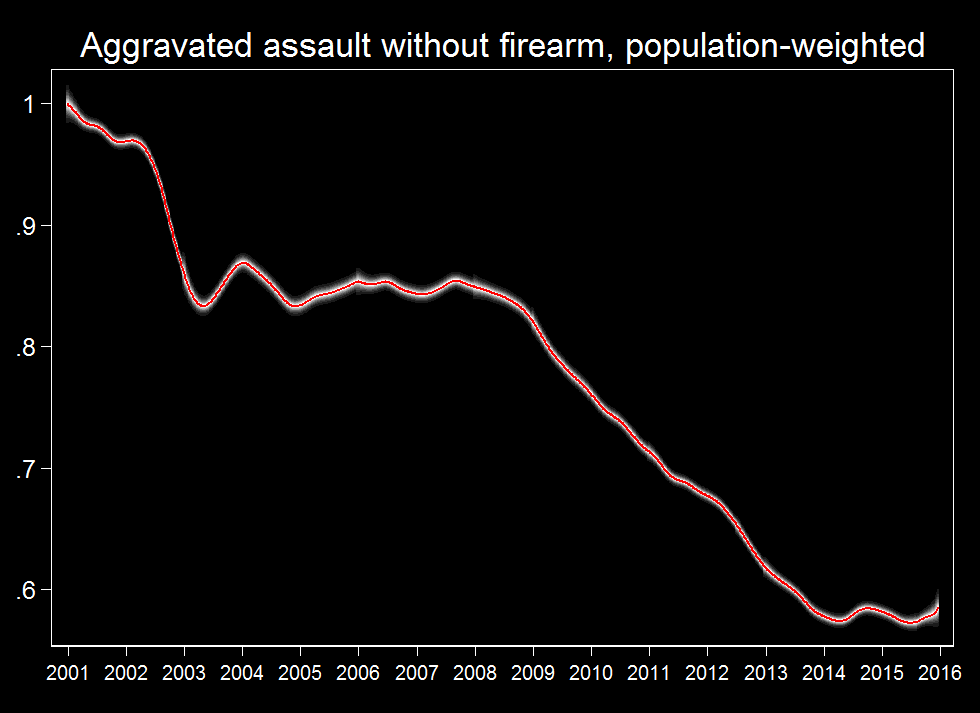
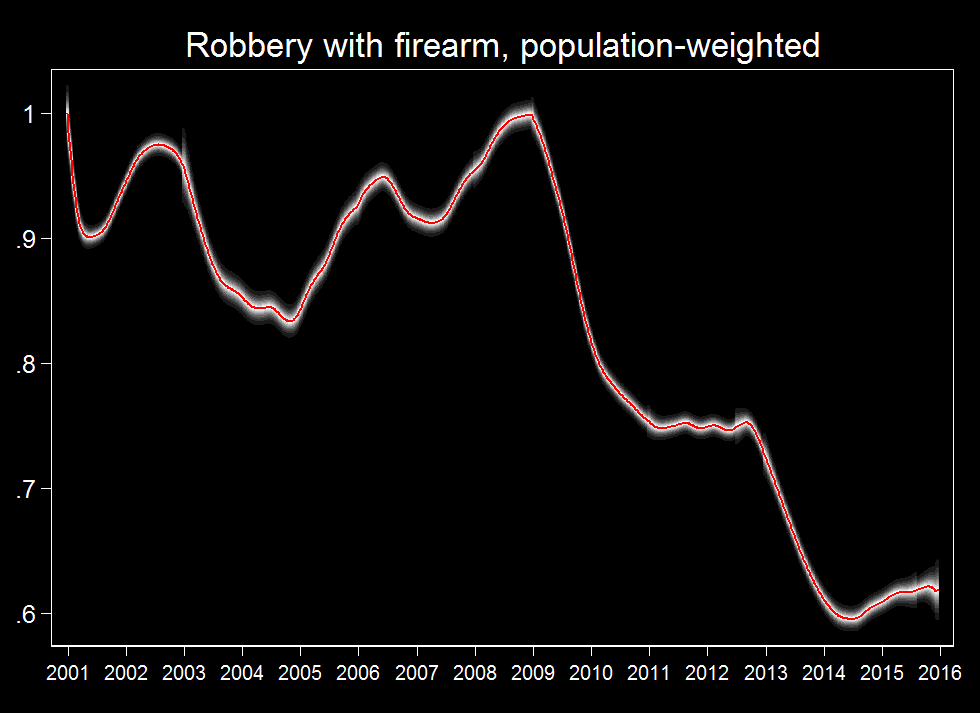
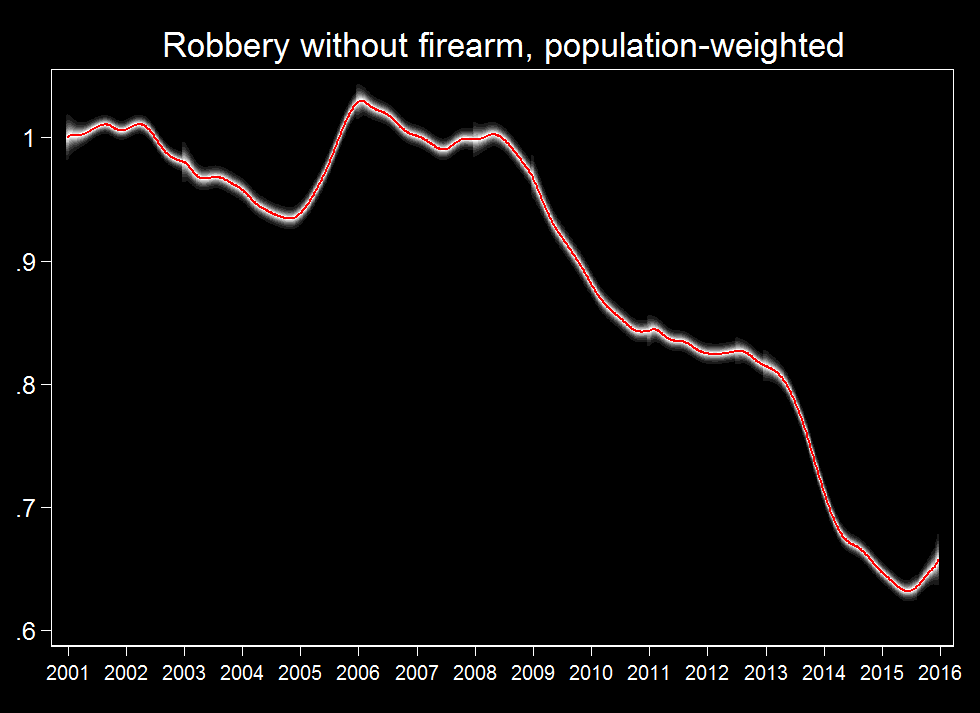
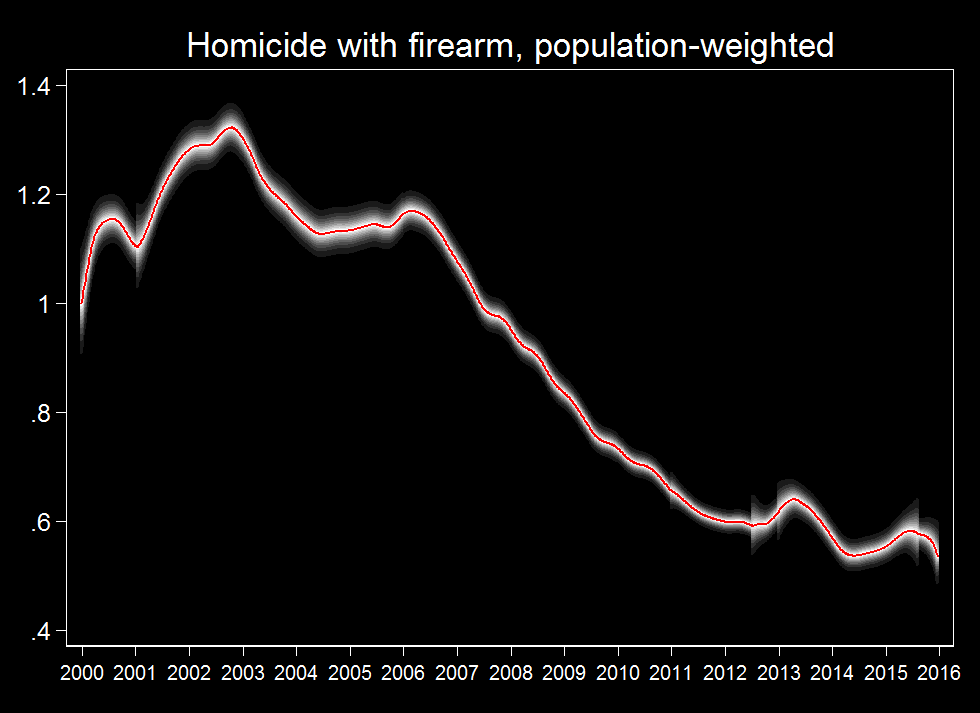
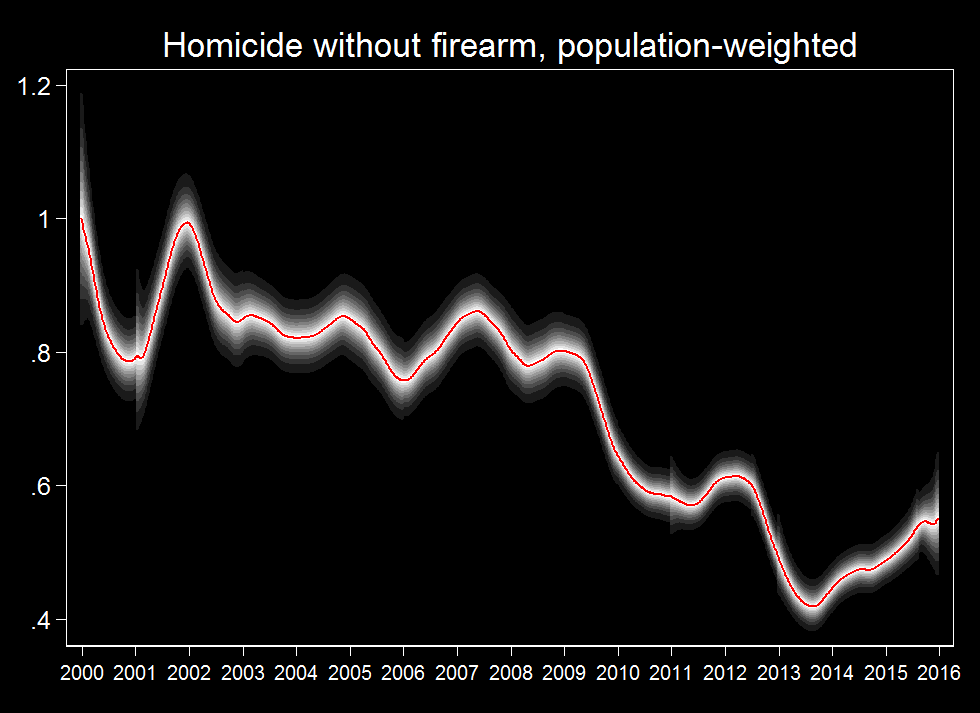
We were struck by the contrast within violent crime, between homicide and other types, with homicide rising much more above trend in the last couple of years. We wondered whether the bump-up is restricted to homicide, or also pertains to a larger subset of violent crimes that are in some sense most like homicide. So we drilled down another level in the FBI typology. The FBI subdivides aggravated assault and robbery by weapon. Following this lead, we subdivided aggravated assault and robbery by firearm involvement for the nine cities with the needed data (assault, robbery). The FBI does not subdivide homicide by weapon but by degree of criminal intent and premeditation. Perhaps for this reason, even fewer cities—just seven that we found—had data on which murders were done with a gun.
It turns out that assaults involving a gun also climbed starting in early 2014, while non-gun assaults did not:
The graphs for robbery also hint at the same split. I see a modest rise since early 2014 in robbery with a firearm along with a sharp drop during 2014 in robbery without a firearm. However the latter may have been mostly reversed in 2015—wide error bands as we approach 2016 leave this unclear.
However, we find the opposite for homicide, with non-firearm killings rising faster:
Confusingly, data limitations force us to base this last comparison on a quite different list of cities. In switching from assault and robbery to homicide, we lose Atlanta, Chicago, Philadelphia, Riverside, St. Louis; retain Baltimore, Boston, Detroit, and San Francisco; and gain Los Angeles, Oakland, and Washington, DC. It may be that in subdividing by gun involvement we are pushing our limited data too far.
What to make of this all? The most heinous kinds of crime—murder, assault with a gun—appeared to rise in 2014 in American cities. But the long-term trend has been strongly downward, violent crime’s recent small uptick has plateaued at worst but more likely declined, and property crime has continued to fall. The upticks are not large by historical standards and appear to have peaked. The increase in heinous crime should not be taken lightly. But suggestions of a crime wave look premature.
