One of Open Phil’s major focus areas is technical research and policy work aimed at reducing potential risks from advanced AI.
To inform this work, I have written a report developing one approach to forecasting when artificial general intelligence (AGI) will be developed. By AGI, I mean computer program(s) that can perform virtually any cognitive task as well as any human, for no more money than it would cost for a human to do it. The field of AI is largely understood to have begun in Dartmouth in 1956, and since its inception one of its central aims has been to develop AGI.1
How should we forecast when powerful AI systems will be developed? One approach is to construct a detailed estimate of the development requirements and when they will be met, drawing heavily on evidence from AI R&D. My colleague Ajeya Cotra has developed a framework along these lines.
We think it’s useful to approach the problem from multiple angles, and so my report takes a different perspective. It doesn’t take into account the achievements of AI R&D and instead makes a forecast based on analogous historical examples.
In brief:
- My framework estimates pr(AGI by year X): the probability we should assign to AGI being developed by the end of year X.
- I use the framework to make low-end and high-end estimates of pr(AGI by year X), as well as a central estimate.
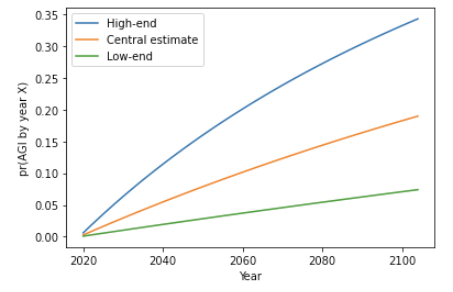
- pr(AGI by 2100) ranges from 5% to 35%, with my central estimate around 20%.
- pr(AGI by 2036) ranges from 1% to 18%, with my central estimate around 8%.
- The probabilities over the next few decades are heightened due to current fast growth of the number of AI researchers and of the computation used in AI R&D.
- These probabilities should be treated with caution, for two reasons:
- The framework ignores some of our evidence about when AGI will happen. It restricts itself to outside view considerations – those relating to how long analogous developments have taken in the past. It ignores evidence about how good current AI systems are compared to AGI, and how quickly the field of AI is progressing. It does not attempt to give all-things-considered probabilities.
- The predictions of the framework depend on a number of highly subjective judgement calls. There aren’t clear historical analogies to the development of AGI, and interpreting the evidence we do have is difficult. Other authors would have made different judgements and arrived at somewhat different probabilities. Nonetheless, I believe thinking about these issues has made my probabilities more reasonable.
- We have made an interactive tool where people can specify their own inputs to the framework and see the resultant pr(AGI by year X).
The structure of the rest of this post is as follows:
- First I explain what kinds of evidence my framework does and does not take into account.
- Then I explain where my results come from on a high level, without getting into the maths (more here).
- I give some other high-level takeaways from the report (more here).
- I describe my framework in greater detail, including the specific assumptions used to derive the results (more here).
- Three academics reviewed the report. At the bottom I link to their reviews (more here).
Acknowledgements: My thanks to Nick Beckstead, for prompting this investigation and for guidance and support throughout; to Alan Hajek, Jeremy Strasser, Robin Hanson, and Joe Halpern for reviewing the full report; to Ben Garfinkel, Carl Shulman, Phil Trammel, and Max Daniel for reviewing earlier drafts in depth; to Ajeya Cotra, Joseph Carlsmith, Katja Grace, Holden Karnofsky, Luke Muehlhauser, Zachary Robinson, David Roodman, Bastian Stern, Michael Levine, William MacAskill, Toby Ord, Seren Kell, Luisa Rodriguez, Ollie Base, Sophie Thomson, and Harry Peto for valuable comments and suggestions; and to Eli Nathan for extensive help with citations and the website. Lastly, many thanks to Tom Adamczewski for vetting the calculations in the report and building the interactive tool.
1. Background: inside-view and outside-view approaches to forecasting AGI
How should we determine our pr(AGI by year X)? One natural approach is to think about the process by which we might create AGI, and then analyse how long this process will take.
Examples of this type of investigation include:
- How much computation would it take to train AGI? When will this amount of computation become affordable?
- What specific problems need to be solved before we develop AGI? How long will it take for these problems to be solved?
- How capable are the best AI systems today compared to AGI? At the current rate of progress, how long will it be before we develop AGI?
These investigations involve forming an inside view:2 mapping out the steps necessary to create AGI, and estimating how long it will take to complete all the steps. We think this is a valuable approach, and have done research in this vein. However, inside-view investigations inevitably involve making difficult judgement calls about complex issues. You might turn out to be mistaken about what steps were required.
An alternative and complementary approach is to consider what you should believe before you learn about the specifics of AI development. One way to make this slightly more concrete is to ask the following question:
Suppose you had gone into isolation when AI R&D began, and only received annual updates about the inputs to AI R&D (e.g. researchers, computation) and the binary fact that we have not yet built AGI. What would be a reasonable pr(AGI by year X) to have at the start of 2021?
In this situation, you might base your pr(AGI by year X) on more general considerations:
- A well funded STEM field has the explicit aim of developing AGI.
- STEM research has led to many impressive and impactful technological advances over the last few centuries.
- AGI would be a hugely transformative development, and it is very rare for such impactful developments to occur.
We can call considerations like these, that draw on similarities between AGI and previous cases, outside view considerations.3
How should we think about the relationship between inside view and outside view approaches to pr(AGI by year X)? The outside view can provide a starting point for pr(AGI by year X), which you can update upwards or downwards based on inside view considerations.
The next section discusses how I forecast AGI from an outside view perspective.
2. How I generated my results, on a high level
I estimate the probability of AGI in two stages.
- I use four reference classes to inform my pr(AGI by year X). At this stage, I ignore the details of exactly how large the AI R&D effort is, assuming it is typical of a STEM R&D field.
- I factor in how quickly the inputs to AI R&D are growing. These inputs are increasing quickly and pr(AGI by year X) increases when I make this adjustment.
Stage 1. To mitigate the problem of choosing a preferred reference class, I try to use some reference classes that suggest high probabilities and some that suggest low probabilities.
The four reference classes considered were:
- Highly ambitious but feasible technology that a serious STEM field is trying to develop.
- AGI seems to be a good fit to this reference class. There is expert consensus that it will be possible eventually and many experts think it may be possible within a few decades.4 Multiple well-funded and prestigious labs have the explicit aim of building AGI, and it has been a central goal of the AI field since its inception.5
- STEM R&D often achieves highly ambitious goals within a number of decades, and has done so across diverse areas of understanding from fundamental physics to biology to applied engineering.
- Based on the similarity of AGI to this reference class, I favor assigning ≥ 5% probability to AGI being developed within the first 50 years of effort. In my framework, this translates to pr(AGI by 2036) ≥ 1% and pr(AGI by 2100) ≥ 7%.
- I put more weight on this than on the other reference classes.
- Technological development that has a transformative effect on the nature of work and society.
- AGI seems to be a good fit to this reference class. It would allow us to automate ~all the cognitive labor humans carry out, which would likely have a transformative effect on work and society.6
- Transformative technological developments don’t happen very often. I suggest there are two good candidates: the Industrial Revolution and the Neolithic Revolution. (I do a sensitivity analysis on other views you might have on this question.) At first glance, this suggests the probability of AGI should be very low: there have been only two such developments in the last 10,000 years. However, if we assume that transformative technological developments are more likely to occur in years where there is more general technological progress, we derive higher probabilities.
- Based on this reference class, I suggest pr(AGI by 2036) ≤ 9% and pr(AGI by 2100) ≤ 35%.
- I put some weight on this reference class, but not that much as there are so few examples of transformative technological developments.
- Other exciting STEM technologies we’re currently working towards.
- I’m assigning some probability to AGI being developed based on it being the goal of a STEM field. But then I should, by analogous reasoning, assign some probability to various other ambitious goals of STEM fields being developed. I don’t want to end up predicting that many more ambitious STEM developments will occur than have occurred in recent decades. This caps the probability I can assign to AGI being developed.
- This reference class has similar implications to the previous one: pr(AGI by 2036) ≤ 9% and pr(AGI by 2100) ≤ 35%.
- I put little weight on this reference class as using it to constrain the probability of AGI involves a number of problematic assumptions.
- Notable mathematical conjectures.
- Perhaps AGI requires a deep insight, like an algorithmic breakthrough. If so, it may be analogous to notable mathematical conjectures.
- Based on an analysis of notable mathematical conjectures by AI Impacts, this reference class suggests pr(AGI by 2036) = 6% and pr(AGI by 2100) = 25%.
- I doubt that resolving a mathematical conjecture is similar to developing AGI, so I view this as the least informative reference class.
This table summarizes the key takeaways from each reference class:
| REFERENCE CLASS | PR(AGI BY 2036) | PR(AGI BY 2100) | WEIGHT |
|---|---|---|---|
| Highly ambitious but feasible technology that a serious STEM field is trying to develop | ≥ 1% | ≥ 7% | Most weight |
| Technological development that has a transformative effect on the nature of work and society | ≤ 9% | ≤ 33% | Some weight |
| Other exciting STEM technologies we’re currently working towards | ≤ 9% | ≤ 33% | Little weight |
| Notable mathematical conjectures | = 6% | = 25% | Least weight |
| Overall view | ≥ 1% ≤ 9% |
≥ 7% ≤ 33% |
I take all four reference classes into account to inform my overall view: my central estimate of pr(AGI by 2036) is 4%, with a range of 1% to 9%; my central estimate of pr(AGI by 2100) is 18% with a preferred range of 7% to 33%.7
As should be clear, these numbers depend on highly subjective judgement calls and debatable assumptions. Reviewers suggested many alternative reference classes.8 Different authors would have arrived at somewhat different probabilities. Nonetheless, I think using a limited number of reference classes as best we can is better than not using them at all.
Here are the low-end, high-end and central estimates of pr(AGI by year X) that I got after Stage 1:
Stage 2. In the second stage, I factor in how quickly the inputs to AI R&D are growing. In particular, I look at trends in the number of AI researchers, and in the computation used to develop AI systems. These inputs are increasing quickly and pr(AGI by year X) increases when I adjust for this:
- AI researchers: It is typical for research fields to grow at 4% per year,9 but my preferred source suggests the number of AI researchers are currently growing at 11%.10 (I do a sensitivity analysis over different assumptions about the growth of AI researchers.) Based on this trend, I find my central estimate of pr(AGI by 2036) is 8%, with a range of 2% to 15%.
- Computation: The amount of computation used in AI R&D has been growing rapidly, due to two trends. First, a long run trend reducing the cost of computation; second, a more recent boost in spending on computation in AI R&D. Based on this trend, I find my central estimate of pr(AGI by 2036) is 15%, with a range of 2% to 22%.
The following graph shows my central estimates for Stage 1 and Stage 2 out to 2100:

(Extrapolating AI researchers and computation inputs beyond a few decades is difficult. The above graph makes some crude empirical assumptions.11)
The following table summarizes my key conclusions about pr(AGI by year X):
| INPUT TO AI R&D | LOW-END | CENTRAL ESTIMATE | HIGH-END |
|---|---|---|---|
| Assume R&D effort is typical (Stage 1) | 1% | 4% | 9% |
| Researcher-year | 2% | 8% | 15% |
| Computation | 2% | 15% | 22% |
| All-things-considered | 1% | 8% | 18% |
| All-things-considered | 5% | 20% | 35% |
To arrive at all-things-considered probabilities, I take a weighted average of the approaches shown in the table, and some other approaches (e.g. I assign some weight to AGI being impossible).12
Remember, these probabilities are based on some highly subjective judgement calls and do not take into account certain types of evidence. For example, perhaps we can rule out AGI happening before (e.g.) 2025 based on the current status of AI R&D. If so, this would lower my probabilities, especially for near-term predictions like pr(AGI by 2036). However, over longer time horizons, I think the probabilities are more meaningful.
3. Other high-level takeaways from this project
The failure to develop AGI by 2020 doesn’t imply it’s very unlikely to happen soon.
One reason to be skeptical that AGI will be developed soon is that we’ve been trying to develop it for a long time and so far have failed. My framework is well suited to calculating how much this factor should reduce our pr(AGI by year X).13 I find that:
- The failure to develop AGI by 2020 tends to prevent pr(AGI by 2036) > 15%.
- This factor doesn’t justify pr(AGI by 2036) < 5%.
- Low-end values like pr(AGI by 2036) = 1% are not driven by the update from failure so far, but by assuming AGI would be very difficult to develop before we started trying.
- However, low values could also be driven by evidence that my framework doesn’t take into account. For example, if you think today’s AI systems are much worse than AGI, you might infer that pr(AGI by 2036) is very low.
I’m skeptical about simple priors.
Initially, I tried to use ‘uninformative priors’ to determine pr(AGI by year X).14 These are approaches that attempt to remain entirely agnostic about the subject matter they are modeling. They abstract away all the details about the thing being forecast;15 as a result they lose valuable information and make unrealistic predictions.16 I found that improving on these rules required confronting some messy conceptual and empirical issues, but I think dealing with these issues as best we can is better than ignoring them entirely. I call the results of my framework a ‘semi-informative prior’.

I’m suspicious of Laplace’s rule, an example of an uninformative prior.
- Laplace’s rule roughly says: ‘If something’s been happening for X years, we should expect it to continue for another X years on average.’
- But this reasoning is suspect. Imagine if someone said ‘How long will this new building last before it’s knocked down? It’s been standing for ~1 month so I’d guess it will stay standing for about another month.’
- The problem is that we have other reasons, separate from this particular building’s historical duration, to think it will stay standing for longer. In this case, we know that buildings typically stand for many years. In general, Laplace’s rule only holds if our main reason to think something will last into the future is its historic duration.
These takeaways and the probabilities discussed above are the main outputs of the report (more here).
4. Structure of the rest of this post
The rest of this blog post describes the framework I used in more mathematical detail. It is a long summary of the report, useful for those wanting to understand the framework and specific assumptions behind my conclusions.
I proceed as follows:
- I introduce uninformative priors in the context of the sunrise problem (more here).
- I describe how uninformative priors can be used to calculate pr(AGI by year X) (more here).
- I explain my framework (more here).
- I apply the framework to calculate pr(AGI by year X) (more here).
- I discuss the framework’s strengths and weaknesses (more here).
- I link to reviewer responses, with my replies (more here).
5. The sunrise problem
My report attempts to estimate pr(AGI by year X) from an outside view perspective. An instructive place to start for an outside view approach is the literature on uninformative priors. The polymath Laplace introduced the sunrise problem:
Suppose you knew nothing about the universe except whether, on each day, the sun has risen. Suppose there have been N days so far, and the sun has risen on all of them. What is the probability that the sun will rise tomorrow?
Just as we wish to bracket off information about how AGI might be developed, the sunrise problem brackets off information about why the sun rises. And just as we wish to take into account the fact that AGI has not yet been developed, it takes into account the fact that the sun has risen on every day so far.
Laplace treats each day as a “trial”; the trial is a “success” if the sun rises and a “failure” if it doesn’t. So there have been N trials and all of them have been successes.
5.1 A simple frequentist approach
On a simple frequentist approach, the probability that the next trial succeeds is simply the fraction of previous trials that succeeded:
\( pr(\text{next trial succeeds}) = (\#\,successes) / (\#\,trials) \)(I use ‘#’ as shorthand for “the number of”.)
For example, if the sun has risen on three out of four days, pr(next trial succeeds) = 3/4.
This answer is unsatisfactory if we have only observed a small number of successes. For example, suppose the sun rose on both of the first two days. Then there have been two trials and two successes: pr(next trial succeeds) = (# successes) / (# trials) = 2/2 = 100%. But observing the sun rise just twice does not warrant certainty that it will rise on the next day.
5.2 Laplace’s rule of succession
We need an adjustment that assigns some probability to failure, even if no failures have occurred. (And conversely, we want to assign some probability to success, even if no successes have occurred.)
Laplace’s proposes his rule of succession, which replaces the above formula with:
\( pr(\text{next trial succeeds}) = (\#\,successes + 1) / (\#\,trials + 1) \)This means that on the first day, with no trials having occurred, pr(next trial succeeds) = (0 + 1) / (0 + 2) = 1/2.
By the second day, one success has occurred, so pr(next trial succeeds) = (1 + 1) / (1 + 2) = 2/3.
On third day, two successes have occurred and still no failures, so pr(next trial succeeds) = (2 + 1) / (2 + 2) = 3/4.
So our initial expectation is that there’s 1/2 a chance of success, and this gets slowly adjusted upwards as we observe successes. We still assign some probability to failure, even if no failures have yet occurred. This addresses the problem with the frequentist formula.
In the sunrise problem, the sun has risen on N out of N days. There have been N trials and N successes. Laplace’s rule then implies:
\( pr(\text{next trial succeeds}) = (\#\,successes + 1) / (\#\,trials + 2) \) \( pr(\text{next trial succeeds}) = (N + 1) / (N + 2) \)(Mathematically, Laplace derives his formula by assuming there is a constant but unknown probability p that the sun rises each day. He places a uniform prior over the true value of p, and updates this prior based on whether the sun rises each day. In this formulation, pr(next trial succeeds) is your expected value of p. Understanding this isn’t needed to follow the rest of the post.)
6. Linking the sunrise problem to AGI timelines
We can apply Laplace’s analysis to get an ‘uninformative prior’ for pr(AGI by year X). Rather than observing that the sun has risen for N days, we have observed that AI researchers have not developed AGI for N years.
In other words, we treat each year as a ‘trial’ with a constant but unknown probability p of creating AGI (‘success’):

The field of AI research is largely understood to have begun by the end of 1956, so a natural choice for the number of trials is 64 (2020 – 1956).17 We have had 64 trials and 0 successes.
Laplace’s rule of succession then implies that the chance AGI is developed in 2021 is pr(next trial succeeds) = (# successes + 1) / (# trials + 2) = 1/66.
What about the probability of developing AGI over a longer period? If AGI isn’t developed in 2021, there will have been 65 trials and still 0 successes. The probability of success in 2022 is 1/67. If 2022 fails as well, the probability of success in 2023 is 1/68. And so on for later years.
For concreteness and historical reasons,18 my report focuses on pr(AGI by 2036): the probability we should assign to AGI being developed by the end of 2036. We can combine the probabilities for the period 2021 to 2036, deducing that pr(AGI by 2036) = 20%.19
However, there is a serious problem with applying Laplace’s rule in this way. It implies that there was a 50% probability of developing AGI in the first year of effort. In the first year there had been no trials at all so pr(next trial succeeds) = (0 + 1) / (0 + 2) = 1/2.
Even worse, you can combine the probability of success in each year to deduce that pr(AGI within the first 10 years of effort) = 91%!20 This is not a reasonable outside view of pr(AGI by year X); highly ambitious technological goals are rarely achieved within a decade.21
In addition, the predictions of Laplace’s rule rely on an arbitrary choice of trial definition. We defined a trial as one year. But if we’d defined a trial as a month or a day we’d have made different predictions.
Similar problems are faced by other ‘uninformative priors’ over pr(AGI by year X).22 The framework I explain in the next section addresses these problems.
7. My framework for calculating pr(AGI by year X)
The root of the problem seems to be that the uninformative prior removes too much knowledge for our purposes. Laplace imagines that we know nothing about the universe except for the observed successes and failures to date. This means we know nothing about how hard it might be to develop AGI, or about how long comparable projects have taken in the past. But in fact we do have such knowledge. For example, we know that highly ambitious research projects are unlikely to succeed in the first 10 years of effort. Our framework should allow us to incorporate outside-view considerations like this.
To do this, I generalize the above Laplacian calculation to take outside view considerations into account. I call the result a semi-informative prior for pr(AGI by year X).

7.1 Explaining my framework
My framework results from generalizing the above Laplacian calculation in three ways.
1. Specify the odds that the first trial succeeds. I call this input the first-trial probability. Laplace assumes it equals 50%, but I’ve argued it should be lower in the case of AGI. Intuitively, this input represents how easy you thought AGI would be to develop before efforts began.
The first-trial probability is the most important input to my framework; I choose its value by looking at analogous historical developments to AGI. It is the main place where outside view considerations are factored into the framework.
To explain the input in some more mathematical detail, let’s recap Laplace’s rule. It says that after observing N trials that are all failures:
\( pr(\text{next trial succeeds}) = (\#\,successes + 1)/(\#\,trials + 2) = 1/(N + 2) \)In my framework, this changes to:23
\( pr(\text{next trial succeeds}) = (\#\,successes + 1)/(\#\,trials + m) = 1/(N + m) \)where m is chosen based on outside view considerations. The first-trial probability is 1/m.
When we haven’t observed many failures (m ≫ N), pr(next trial succeeds) will be mostly influenced by the first-trial prior. When we have observed many trials (N ≫ m), pr(next trial succeeds) will mostly be influenced by the number of failures.
(Mathematically, this first change to Laplace’s rule of succession corresponds to replacing Laplace’s uniform distribution over p with a beta distribution. This generalization of Laplace’s rule using a beta distribution is standard.24 The first-trial probability (ftp) can be defined in terms of the beta distribution’s two shape parameters α and β: ftp = α / (α + β). I find that you get reasonable results if you hold α = 1 fixed while changing ftp.25 Again, you don’t need to follow this paragraph to understand what follows!)
I generalize the above Laplacian calculation in two further ways.
2. Specify the regime start-time. The above calculation assumed that efforts to create AGI began at the end of 1956. We ignored the failure to create AGI before this time, assuming it was not relevant to the prospects in the new regime. But other start-times are reasonable (see more). An earlier start-time would increase the number of observed failed trials, and so decrease pr(AGI by year X).
3. Choose the trial definition. The above calculation defined a trial as 1 year of calendar time. My report explores two alternatives, defining trials in terms of i) the number of AI researchers, and ii) the amount of computation used in AI R&D. If these R&D inputs are forecast to grow rapidly, more trials will occur each year and pr(AGI by year X) increases. The first-trial probability should depend on trial definition (see more).26
(These last two changes aren’t generalizing Laplace’s rule per se, but rather explicitly recognizing the start-time and trial definitions inputs that can reasonably be changed.)
So there are three inputs to my framework:27
- First-trial probability: how hard did you think AGI would be before you started trying?
- Regime start-time: failure to develop AGI before this time is ignored.
- Trial definition: time, researchers, or computation.
7.2 Example application of the framework
Suppose your inputs are:
- First-trial probability = 1/100
- Regime start-time = 195628
- Trial definition = 1 calendar year
Initially, pr(next trial succeeds) = (# successes + 1) / (# trials + m) = (0 + 1) / (0 + 100) = 1/100.
After 2020, having observed N = 64 failures, pr(next trial succeeds) = (# successes + 1) / (N + m) = 1 / (64 + 100) = 1/164. Combining the probabilities from 2021 to 2036, pr(AGI by 2036) = 9%.29
This is lower than the Laplacian calculation of 20%, which used first-trial probability = 1/2.
7.3 Summarizing the framework
Like the application of Laplace’s rule, my framework models AGI development as a series of “trials” with a constant but unknown probability p of success.

Three inputs – first-trial probability, regime start-time, and trial definition – define what I call an “update rule”. The update rule, once updated with the failure to develop AGI so far, determines pr(AGI by year X) in future years. When we use outside view considerations to choose the inputs, I call the result a semi-informative prior for pr(AGI by year X).

I find it useful to think about the three inputs in terms of how they influence pr(next trial succeeds) and the number of trials in each year, thereby influencing pr(AGI by year X):
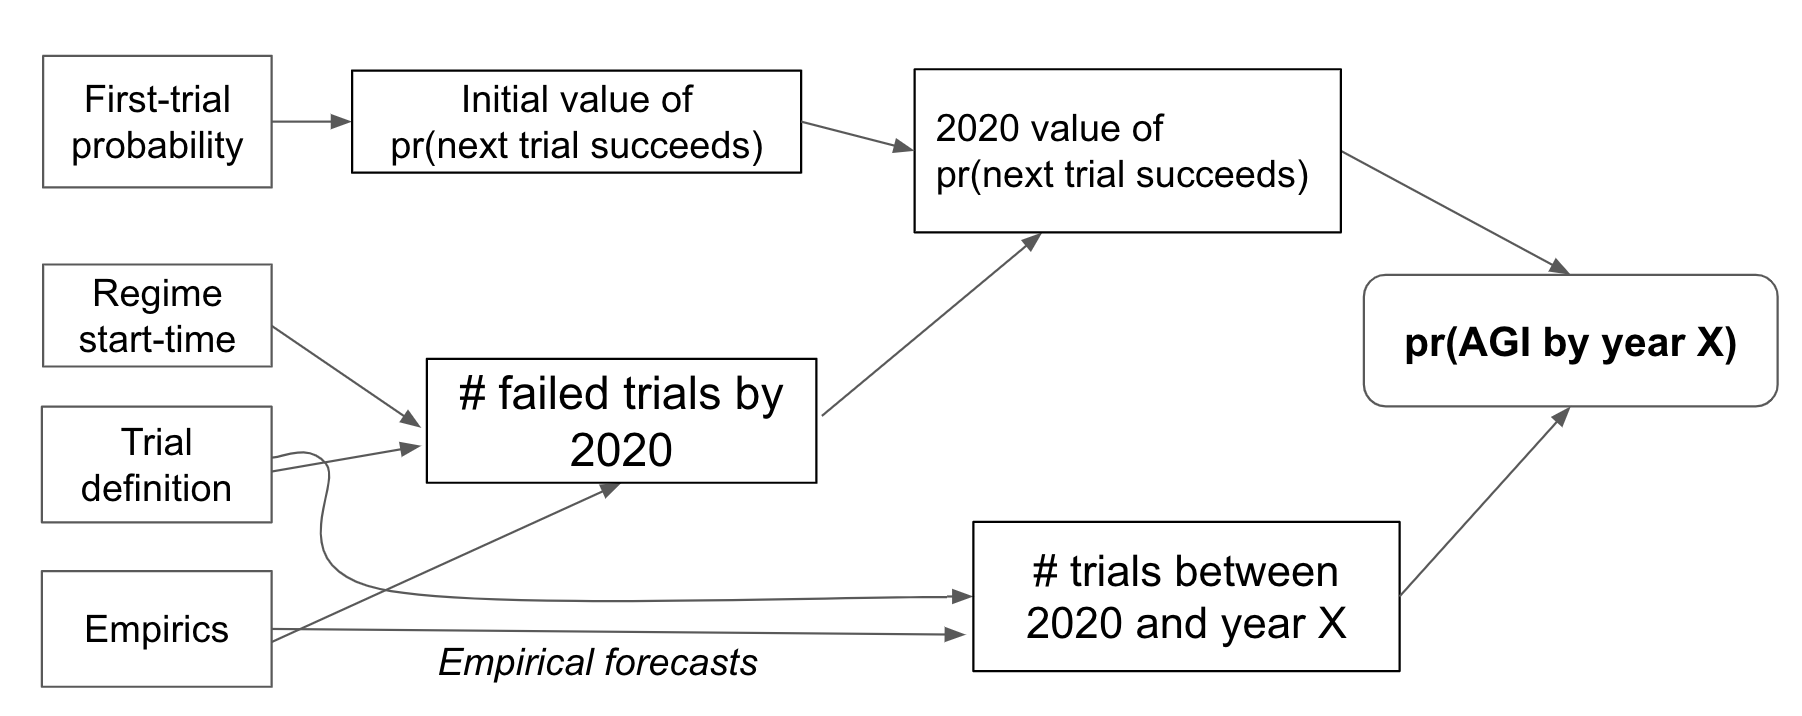
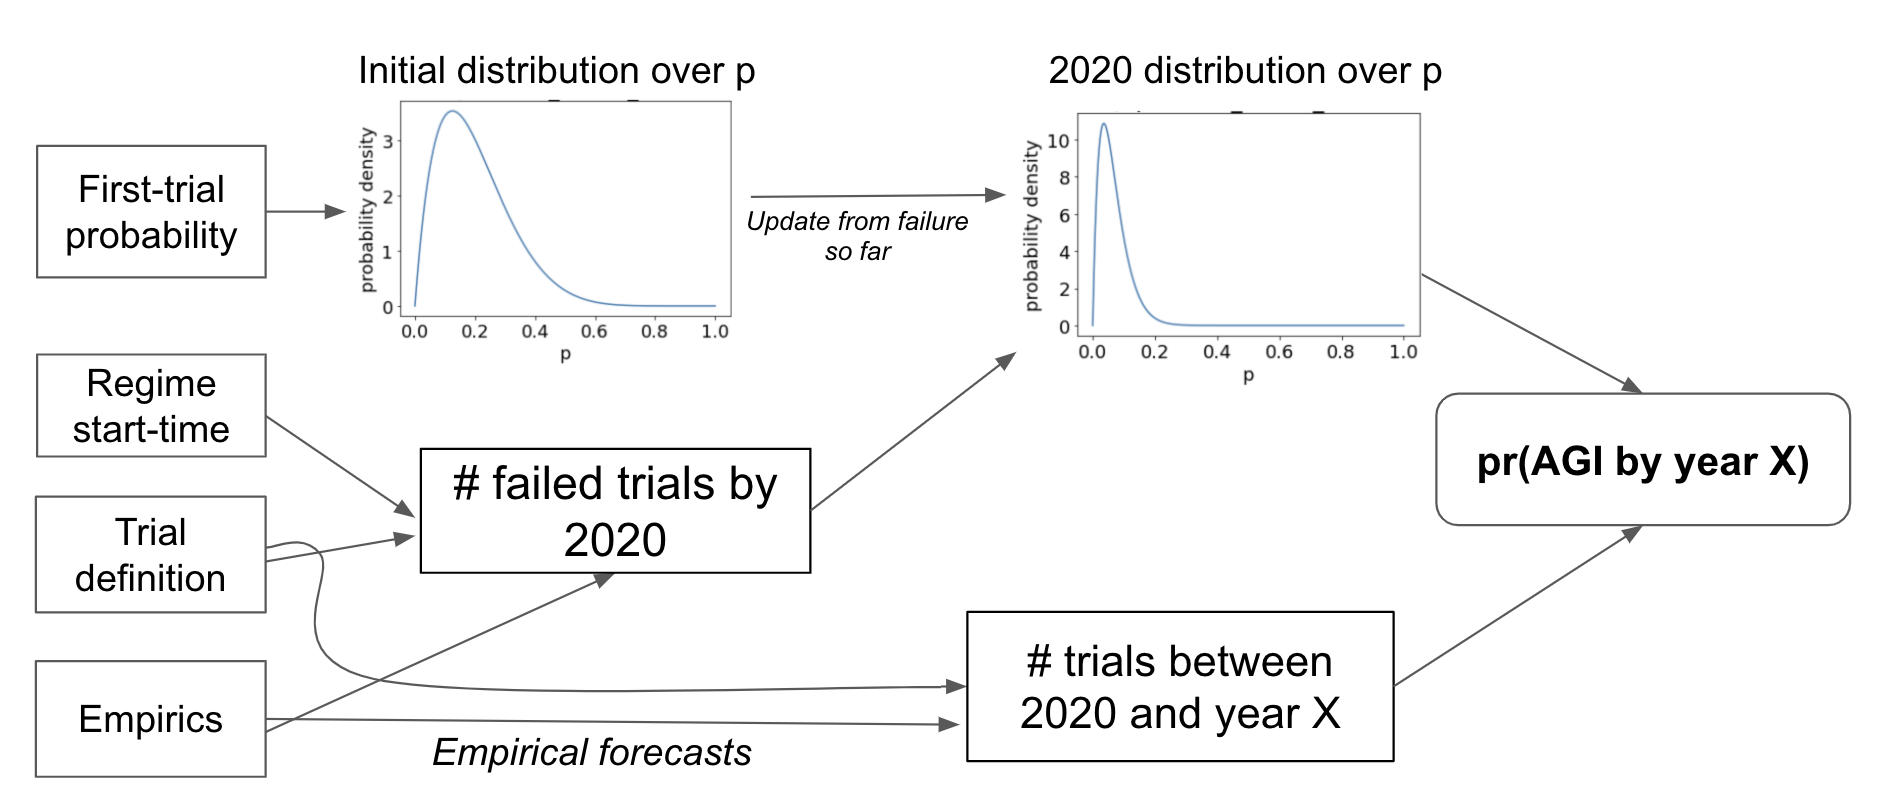
The first-trial probability equals the initial value of pr(next trial succeeds). The start-time and trial definition determine how many failures we’ve observed so far, which then influences the 2020 value of pr(next trial succeeds). The trial definition, perhaps together with empirical forecasts of AI researchers and computation, determine the number of trials in future years. This combines with the 2020 value of pr(next trial succeeds) to determine pr(AGI by year X).
The next diagram summarizes the framework from a more mathematical perspective:
7.4 Evaluating the framework
The report explains how the framework addresses the two problems we identified with Laplace’s rule:
- Unrealistically high probability of success in the early years of effort (see more and more).
- In essence, we guard against this with a lower first-trial probability.
- Results depend on an arbitrary choice of trial definition (see more).
- If you change your trial definition from ‘1 calendar year’ to ‘1 month’, you should change your first-trial probability to compensate.
I discuss the important strengths and weaknesses of the framework below. The most important takeaways are:
- A key limitation is that it excludes information about how far the current field of AI is from AGI, and how fast it’s progressing.
- A seemingly strong objection is that AI R&D is not actually a series of independent trials.
- I suggest this objection isn’t as important as it seems because it is the inputs to the framework, not the mathematical form, that drives the results.
- Indeed, I found that more realistic models gave similar results.
Appendices to the report answer further questions about the framework:
- Is it a problem that the framework treats inputs to AI research as discrete, when in fact they are continuous?
- Does this framework assign too much probability to crazy events happening?
- Is the framework sufficiently sensitive to changing the details of the AI milestone being forecast? I.e. would we make similar predictions for a less/more ambitious goal?
- How might other evidence update you from your semi-informative prior?
One quick note: perhaps we can rule out AGI happening before the end of (e.g.) 2025 based on state of the art AI R&D. The framework can accommodate this by updating on the failure to create AGI by 2025, rather than 2020. I use 2020 in the report because thinking about how long into the future we can rule out AGI on this basis is outside the purview of the project.
We’ve discussed my framework, and how it builds upon uninformative priors. The next section applies it to AGI. Then I discuss its strengths and weaknesses.
8. Applying the framework to AGI
The report proposes upper and lower bounds for the framework’s inputs and performs a sensitivity analysis when this cannot be done.
I find that the most important input for pr(AGI by year X) is the first-trial probability. Most of the report estimates the first-trial probability for three trial definitions, assuming start-time = 1956. I’ll proceed the same way here, and discuss the effect of the start-time later.
The following table summarizes how the report deals with each input:
| FIRST-TRIAL PROBABILITY (FTP) | START-TIME | TRIAL DEFINITION |
|---|---|---|
| Use analogous historical developments to suggest upper and lower bounds. | Mostly use 1956; conduct a sensitivity analysis for alternatives. | Define trials in terms of calendar years, number of AI researchers, and the computation used in AI R&D. |
8.1 Trial = ‘1 calendar year’
This section discusses how I choose the first-trial probability (ftp) when the trial definition is ‘1 calendar year’. I assume start-time = 1956 unless I say otherwise. (This corresponds to ‘stage 1’ as described earlier in this post; the other trial definitions correspond to ‘stage 2’.)
On a high level, my methodology is:
- Identify several reference classes for AGI, e.g. “explicit goal of a STEM field”, “transformative technology”.
- Use each reference class to estimate ftp, or to find an upper or lower bound.
- Weigh different reference classes according to how informative they are about AGI’s difficulty.31
The constraints I obtain are highly subjective; I see them merely as guides. They depend on difficult judgement calls about which reference classes to use and how to interpret them. Different authors would have arrived at different pr(AGI by year X). Nonetheless, I believe that the process of applying the framework has improved my pr(AGI by year X). In the report, I structure the discussion of each reference class so as to help readers to draw their own conclusions about AGI.
I use four reference classes to inform my choice of ftp. In this blog, I talk through my reasoning relating to the most important two reference classes.
8.1.1 AGI as a goal of a STEM field
The reference class I put most weight on is “highly ambitious but feasible technology that a serious STEM field is explicitly trying to develop”. AGI fits into this category fairly well. Although AGI is a very ambitious goal, there is expert consensus that it will be possible eventually and many experts think it may be possible within a few decades.32 Multiple well-funded and prestigious labs have the explicit aim of building AGI, and it has been a central goal of the AI field since its inception.33
What does this reference class tell us? STEM R&D has recently had an excellent track record, often achieving highly ambitious goals within a number of decades. Here are a few examples:
- In 1930 we didn’t know about the strong nuclear force, but by 1945 we’d created the atom bomb and by 1951 the first nuclear power plant (source).
- In 1927 we didn’t know that DNA carried genetic information and hadn’t identified its component parts; but by 1957, the relationship between DNA, RNA and proteins (the “central dogma”) was understood (source). In 2020, we can rapidly sequence DNA, synthesize DNA, and cut-and-paste DNA in living cells (with CRISPR) (source).
- In 1900, treatments for infections were primitive and non targeted, but by 1962 most of the antibiotic classes we use today had been discovered and introduced to the market (source).
- Before 1900 we hadn’t managed sustained and controlled heavier-than-air flight, but by 1969 we’d landed a man on the moon and flown a jumbo jet that could carry 366 passengers.
These examples are very far from comprehensive, and there is clearly a selection bias in this list. However, it does show that STEM research can make very significant advances within a few decades in diverse areas of understanding. Given that AGI fits this reference class fairly well, I think we should assign some probability to AGI being developed in a comparable timeframe.
How can we use this reference class to inform our choice of ftp? Based on this reference class, I favor assigning 5% to AGI being developed in the first 50 years, so I favor ftp ≥ 1/1000. I wouldn’t want to assign more than 50% to this, so I also favor ftp ≤ 1/50 (see more).
8.1.2 AGI as transformative technology
I also put weight on the reference class “technological development that has a transformative effect on the nature of work and society”. Again, AGI fits this category fairly well. It would allow us to automate ~all the cognitive labour humans carry out; this would likely have a transformative effect on work and society.34
Transformative technological developments don’t happen very often. Still, we can tentatively use their historical frequency to estimate the annual probability that another one occurs, ptransf. AGI is a specific example of a transformative technological development, so our annual probability that AGI is developed should be no higher than ptransf.
Estimating ptransf cannot be done without some debatable assumptions. I assume that transformative technology is more likely to be developed in a given year if there’s more general technological progress in that year. More precisely, if technology improves by 2%, a transformative development is twice as likely than if technology improves by just 1%. This assumption implies that transformative developments are more likely to happen in modern times than in ancient times, as technological progress is now much faster.
To estimate ptransf we need two further assumptions:
- How many transformative developments have occurred throughout human history?
- How much technological progress has been made throughout human history?
I discuss what assumptions might be reasonable, and conduct a sensitivity analysis over a range of possibilities.
Let’s write ptransf(y) to signify the probability of a transformative development in year y. With these assumptions we can estimate ptransf(y):
If you assume two transformative developments have occurred,35 estimates of ptransf(1957) range from 1/40 to 1/130.36 (If you assume n transformative developments have happened, estimates range from n/80 to n/260.)
How can we use this to guide our choice of first-trial probability? Remember, our annual probability that AGI is developed should be no higher than ptransf. So our first-trial probability should be no higher than ptransf(1957). Based on this reference class, I prefer ftp ≤ 1/100. More on this reference class.
8.1.3 Overall view
Overall, based on considering all four reference classes, I favor a first-trial probability in the range [1/1000, 1/100]. If I had to pick one number I’d go with ~1/300. To reiterate, these numbers depend on highly subjective judgement calls about which reference classes to use and how to interpret them. Nonetheless, I think using a limited number of reference classes as best we can is better than not using them at all.
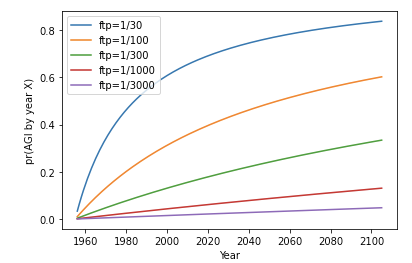
This first-trial probability range corresponds to pr(AGI by 2036) between 1.5% and 9% and pr(AGI by 2100) between 7% and 33%.
Here is pr(AGI by year X) over the first 150 years of effort, for various first-trial probabilities (ftp):
Here is pr(AGI by year X) again, this time after updating on the failure to develop AGI by 2020:
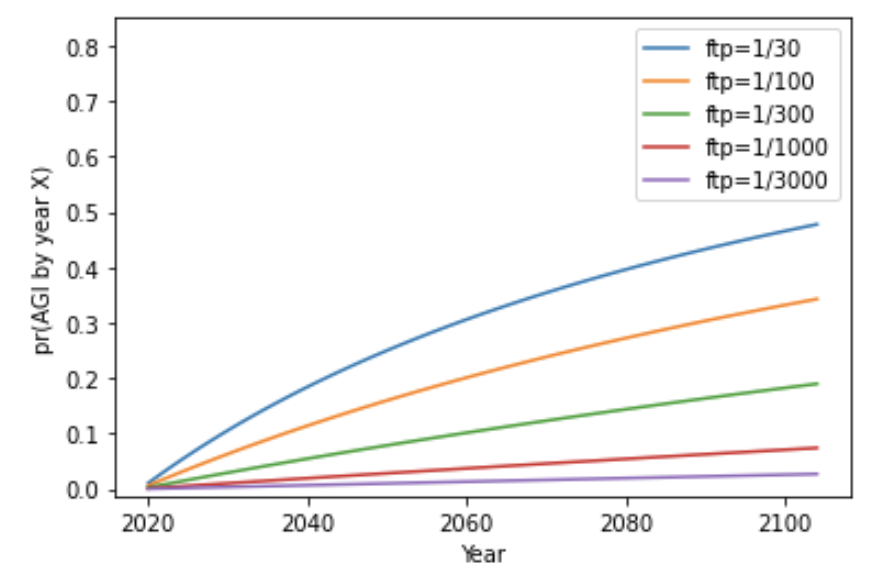
Notice that the initial steepness of the green, red, and purple lines is similar in both graphs. In these cases the update from failure makes little difference to pr(next trial succeeds). These update rules start off thinking AGI will be very hard, and so a mere 56 years of failure makes little difference.
So, we’ve discussed how to choose ftp when a trial = ‘1 calendar year’. This corresponds to ‘stage 1’ as discussed above. The next two sections correspond to ‘stage 2’ and they define trials in terms of researchers and computation. In both cases, the fast growth of these R&D inputs will lead to more trials occurring per year (where these trials are equivalent to ‘1 calendar year’ in that they have the same first-trial probability: ftp = 1/300).
8.2 Trials relating to AI researchers
The number of STEM researchers has been growing exponentially over the past century.37 I define trials so that if the number of researchers grows exponentially, there are a constant number of trials per year.38
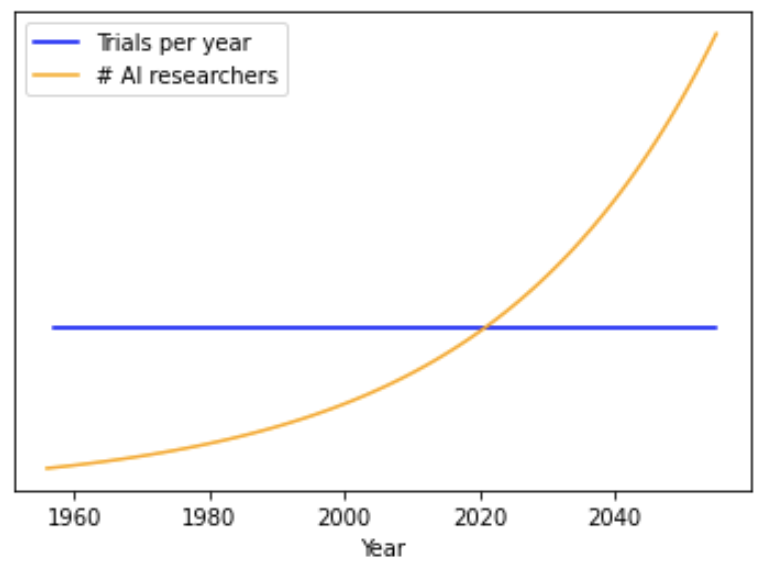
Defining trials this way, rather than saying the number of trials each year increases as the field grows,39 incorporates diminishing returns to AI R&D (see more).
How many trials occur each year? It is typical for the number of researchers in a STEM field to grow at 4% per year.40 If the number of AI researchers grows by 4% per year, I assume one trial occurs each year. (I use the same ftp as before: 1/300.) In this case, pr(AGI by year X) is identical to the previous section when a trial was ‘1 calendar year’; we get exactly the same results as in ‘stage 1’.
But if the number of AI researchers grows at 8% per year, then I assume two trials occur each year, boosting pr(AGI by year X). If the number of AI researchers grows at 12% per year, then three trials occur each year. If growth is only 2%, then only 0.5 trials occur each year. In this way we convert growth of AI researchers into the calendar year trials that we were using previously. Then our calculation can proceed as before.
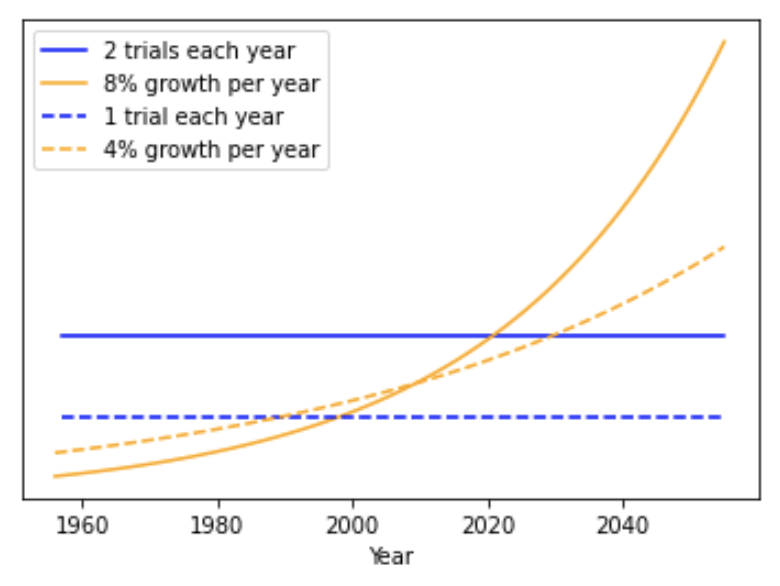
(So we define a trial as a 4% increase in the number of AI researchers, and use the same ftp as when a trial was ‘1 calendar year’ – in my case 1/300.41)
How quickly are the number of AI researchers actually growing? I consult a number of sources that suggest numbers ranging from 3% to 21%. My preferred source is the AI index 2019, which finds that the number of peer-reviewed papers has grown by 11% per year on average over the last 20 years.
Here are the graphs of pr(AGI by year X) again, this time for various assumptions about the growth g of AI researchers. [Note: all these are based on the assumption that ftp = 1/300.]
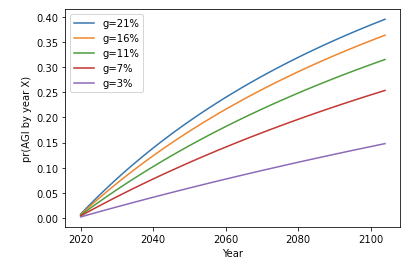
The probabilities are higher than when a trial = ‘1 calendar year’, but the shape of the curve is the same. To interpret the above graph remember: if g = 11% then 11/4 = 3.75 trials are happening each year, and our ftp for these trials was 1/300.42
The above graph assumes that the number of AI researchers will continue to increase at the stated rates until 2100, which is not realistic for large g. In the next graph, I assume that in 2036 g changes to 4%, the typical historical rate.
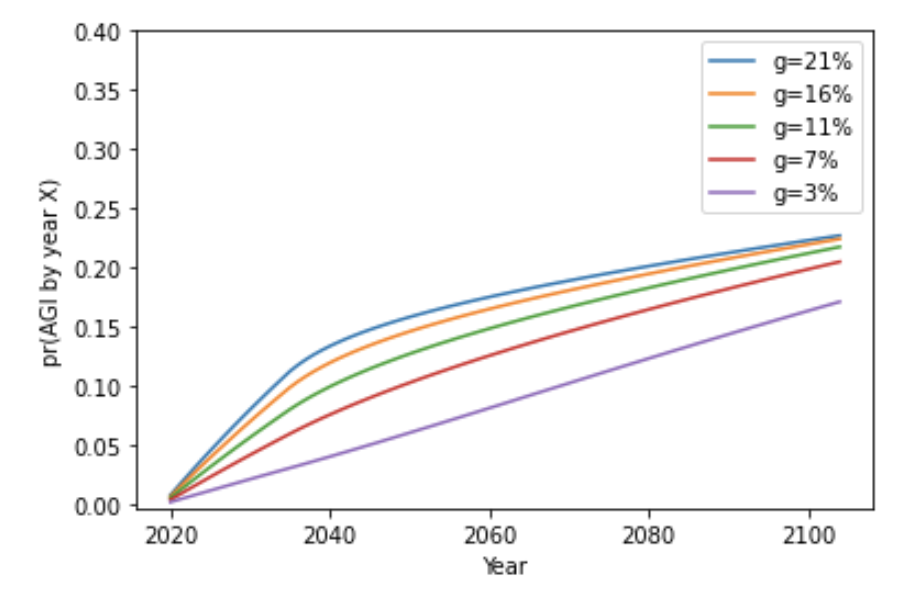
With this methodology, estimates of pr(AGI by 2036) range from 2% to 15%. See sensitivity analysis.
8.3 Trials relating to computation
People have claimed that increases in the computation used to train AI systems is a key driver of progress. How could we extend the framework to take this into account? I do so by defining trials in terms of the computation used to develop the largest AI systems.43 As with researchers, I define trials so that exponential growth in computation leads to a constant number of trials occurring each year.
In the last section, I suggested that the number of researchers had to grow at 4% for one trial to occur each year. How quickly must computation grow for one trial to occur each year?
I consider two approaches to this question.
8.3.1 How important are researchers compared to computation?
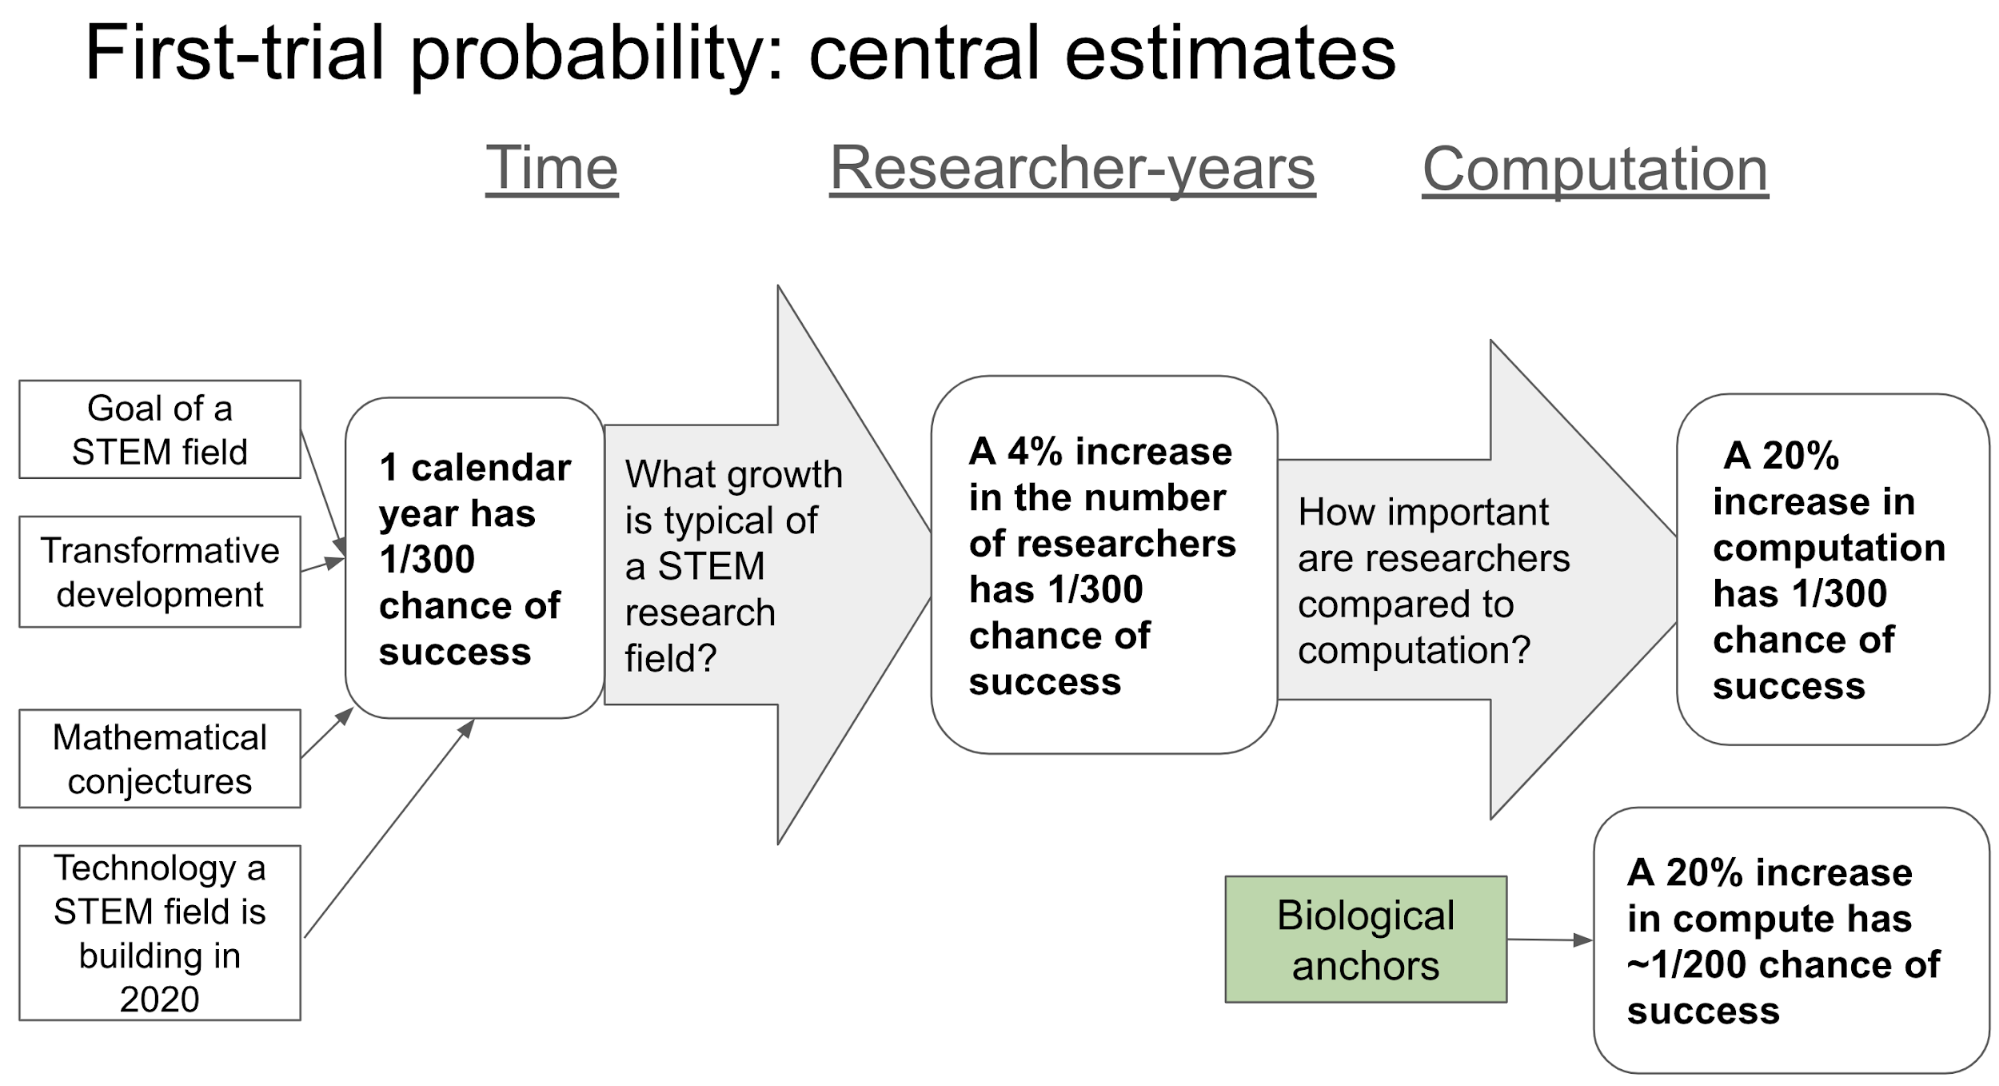
The first approach considers the relative importance of adding more researchers vs adding more computation to AI R&D. I assume that increasing the number of researchers by 1% has a similar effect to increasing the amount of computation by 5%.44
Why 5%? The number is based on a recent analysis from OpenAI that suggests that, on an image classification task, a 1% increase in the number of researchers has a similar benefit to a 5% increase in computation.45 This argument for 5% is merely suggestive; other choices would be reasonable and the report does a sensitivity analysis (more here).
We previously said one trial corresponded to a 4% increase in AI researchers; this corresponds to a 5 × 4 = 20% increase in the amount of computation. So if the amount of computation increases by 20% in a year, one trial occurs that year. (I continue to use ftp = 1/300.) If computation increases by 40% in a year, two trials occur that year.46 If computation increases by 10%, only 0.5 trials occur. In this way we translate the growth of computation to the calendar year trials we used initially.47 Our calculation can then proceed as in the calendar years section.
(So we define a trial as a 20% increase in computation, and use the same ftp as when a trial was ‘1 calendar year’ – in my case 1/300.48)
8.3.2 Use biological anchors
The second approach is quite different. It attempts to anchor our estimate of ftp to the amount of computation used in the human brain.
I consider two anchors:
- Lifetime computation: the computation inside a human brain during the first 30 years of life.49
- Evolution computation: the total computation needed for the human brain to evolve.50
In both cases, I assume that by the time we’ve used that amount of computation to develop one AI system, there’s a 50% chance that we’ll have developed AGI. This assumption pins down ftp.
In my opinion, the lifetime computation assumption probably underestimates computation requirements, and the evolution computation assumption probably overestimates computation requirements. However, both assumptions would have been salient and natural ones to make in 1956, before knowing about trends in how much computation is required to develop systems that perform various tasks,51 and it is interesting to compare and contrast their implications.52 More on my framework’s use of bio-anchors.
8.3.3 The results for both approaches
The two approaches lead to similar probabilities of AGI being developed by the time we’ve used various amounts of computation (measured in FLOP).53
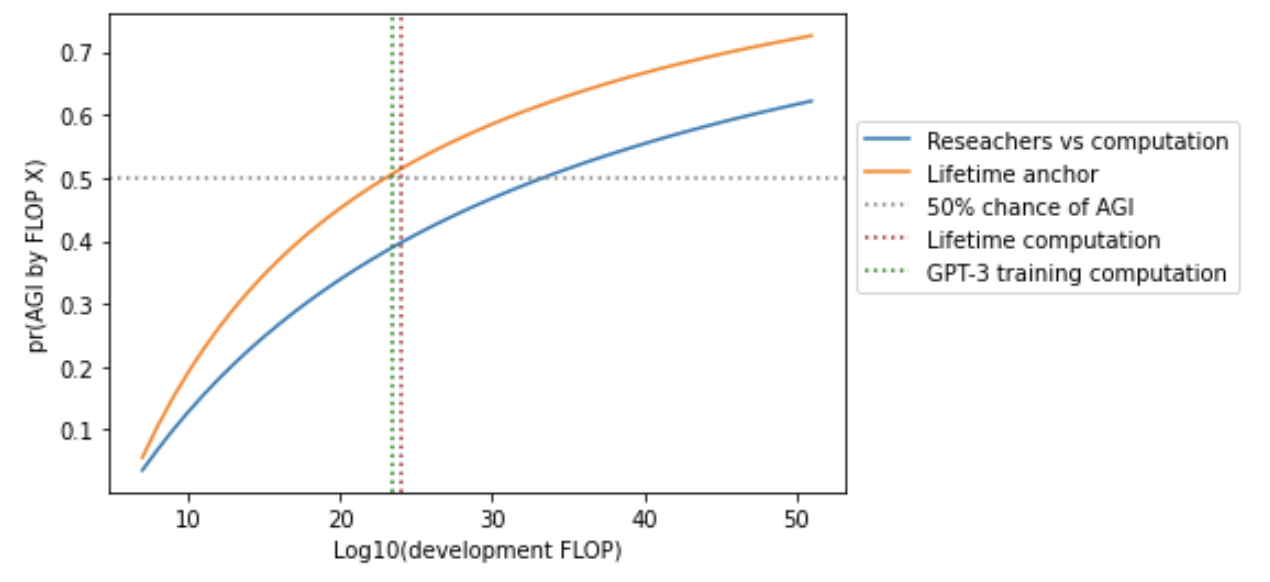
To get a probability distribution over years we must forecast how quickly the computation used in AI research will grow. Then we can calculate the number of trials each year.
The following graph assumes that:
- Spending on computation will rise to $1 billion by 2036, and then stay constant.54
- The cost of computation will fall by 100X by 2036, and then halve every 2.5 years.55
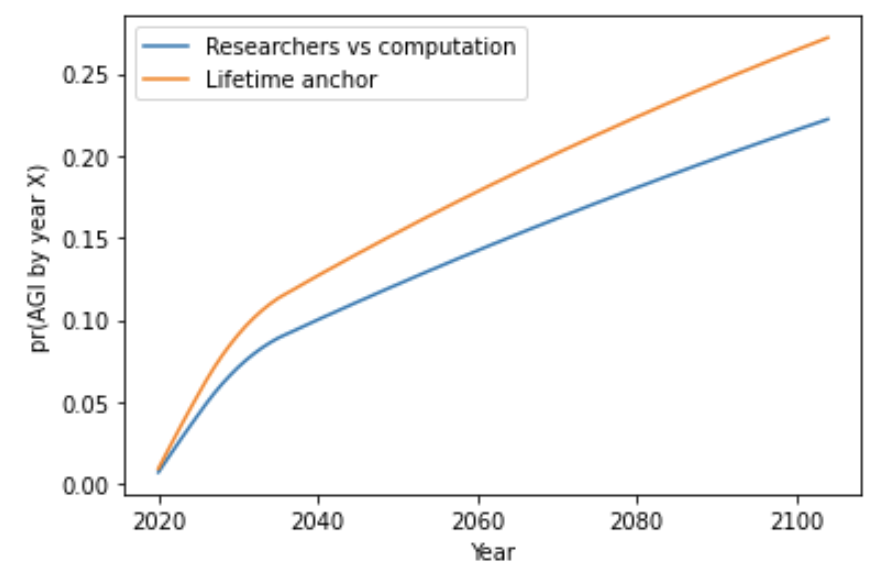
Estimates of pr(AGI by 2036) range from 2% to 22%. See sensitivity analyses here and here.
8.4 Comparing the central estimates for all three trial definitions
Here are the central estimates for pr(AGI by year X) out to 2100 of the approaches I’ve discussed. The graph makes crude empirical forecasts past 2036.56
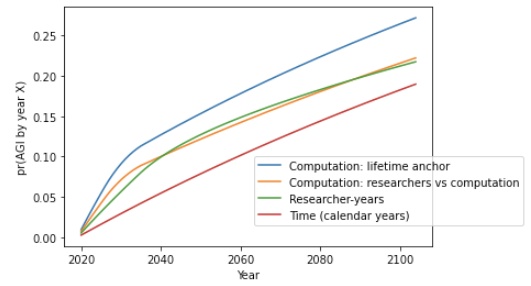
[Repeating diagram above for clarity.]

8.5 What about the regime start-time?
So far we’ve assumed start-time = 1956. How do the results change when we relax this assumption? The report conducts sensitivity analyses here and here; here I summarise the results.
8.5.1 Late regime start-times
A later start-time means you’ve observed fewer failures, and your pr(next trial succeeds) is higher. This boosts probabilities significantly when the first-trial probability is large. With a small first-trial probability, it makes little difference (more on why this is).
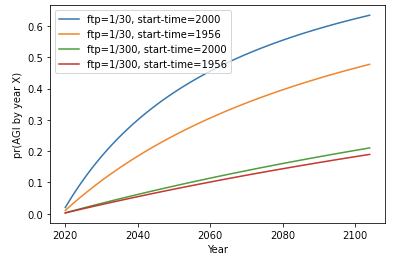
In practice, a late start-time makes the most difference for the computation trial definition. In fact, the evolution anchor assumes that AGI cannot be created before we use as much computation as would be needed to run the brain for a couple of weeks. This only happened fairly recently, so the evolution anchor has a late start-time.57 As a result its probabilities are noticeably higher than the other computation-based approaches, even though it is conservative in other ways.
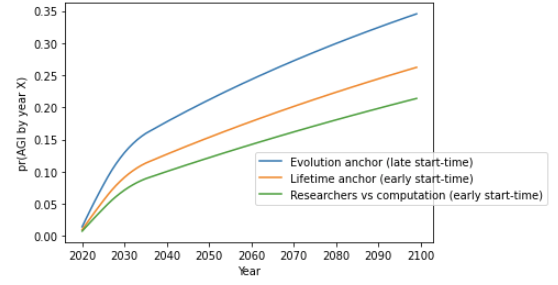
8.5.2 Early regime start-times
An earlier regime start-time means you’ve observed more failures, and so your pr(next trial succeeds) is lower. But I find that even very early start-times (e.g. 5,000 BC) have limited effect once you account for technological progress being faster now than in ancient times. They curb high-end values of pr(AGI by 2036), reducing pr(AGI by 2036) down towards ~5%. But they won’t push pr(AGI by 2036) much below 5%, and certainly not below 1%. So a very early start-time doesn’t materially affect the low-end estimates of pr(AGI by 2036).58 More on early regime start-times.
8.6 How pr(AGI by 2036) depends on different inputs
Let’s draw together all the possibilities we’ve considered so far.
For concreteness, the report focuses on pr(AGI by 2036). The inputs affecting this, from most to least important, are as follows:59
- First-trial probability (ftp): How easy did you think AGI would be before efforts began?
- The choice and interpretation of reference classes play a critical role in the choice of ftp.
- Its choice is highly subjective.
- Must be re-estimated for each trial definition.
- Trial definition: Calendar years, researcher-years, or computation.
- Empirical forecasts: How fast will inputs (researcher-years, computation) grow?
- Start-time: Failures before this time are ignored.
- A late start-time boosts high-end probabilities.
This table shows how these key inputs affect pr(AGI by 2036).60
| TRIAL DEFINITION | – FTP = 1/1000 – CONSERVATIVE EMPIRICAL FORECASTS61 |
– FTP = 1/300 – MODERATE EMPIRICAL FORECASTS62 |
– FTP = 1/100 – AGGRESSIVE EMPIRICAL FORECASTS |
– HIGH FTP – AGGRESSIVE EMPIRICAL FORECASTS63 – LATE START-TIME (200064) |
|---|---|---|---|---|
| Calendar year | 1.5% | 4% | 9% | 12% |
| Researcher-year | 2% | 8% | 15% | 25% |
| Compute65 | 2% | 15% | 22% | 28% |
See more here.
The next section discusses how to form an overall view with so many possible inputs.
8.7 Hyper-priors
Recall, each “update rule” is defined by three inputs:

We’ve considered a large number of possible update rules. What should we do if we’re uncertain about which we should use?
I placed a hyper-prior over different update rules. This means that I assign an initial weight to each rule based on how plausible it is. Then I update this weight, depending on how strongly the rule expected AGI to be developed by 2020. Rules that confidently expected AGI are down-weighted; those that didn’t are up-weighted. I then use the 2020 weights to calculate pr(AGI by year X)66 (more here).
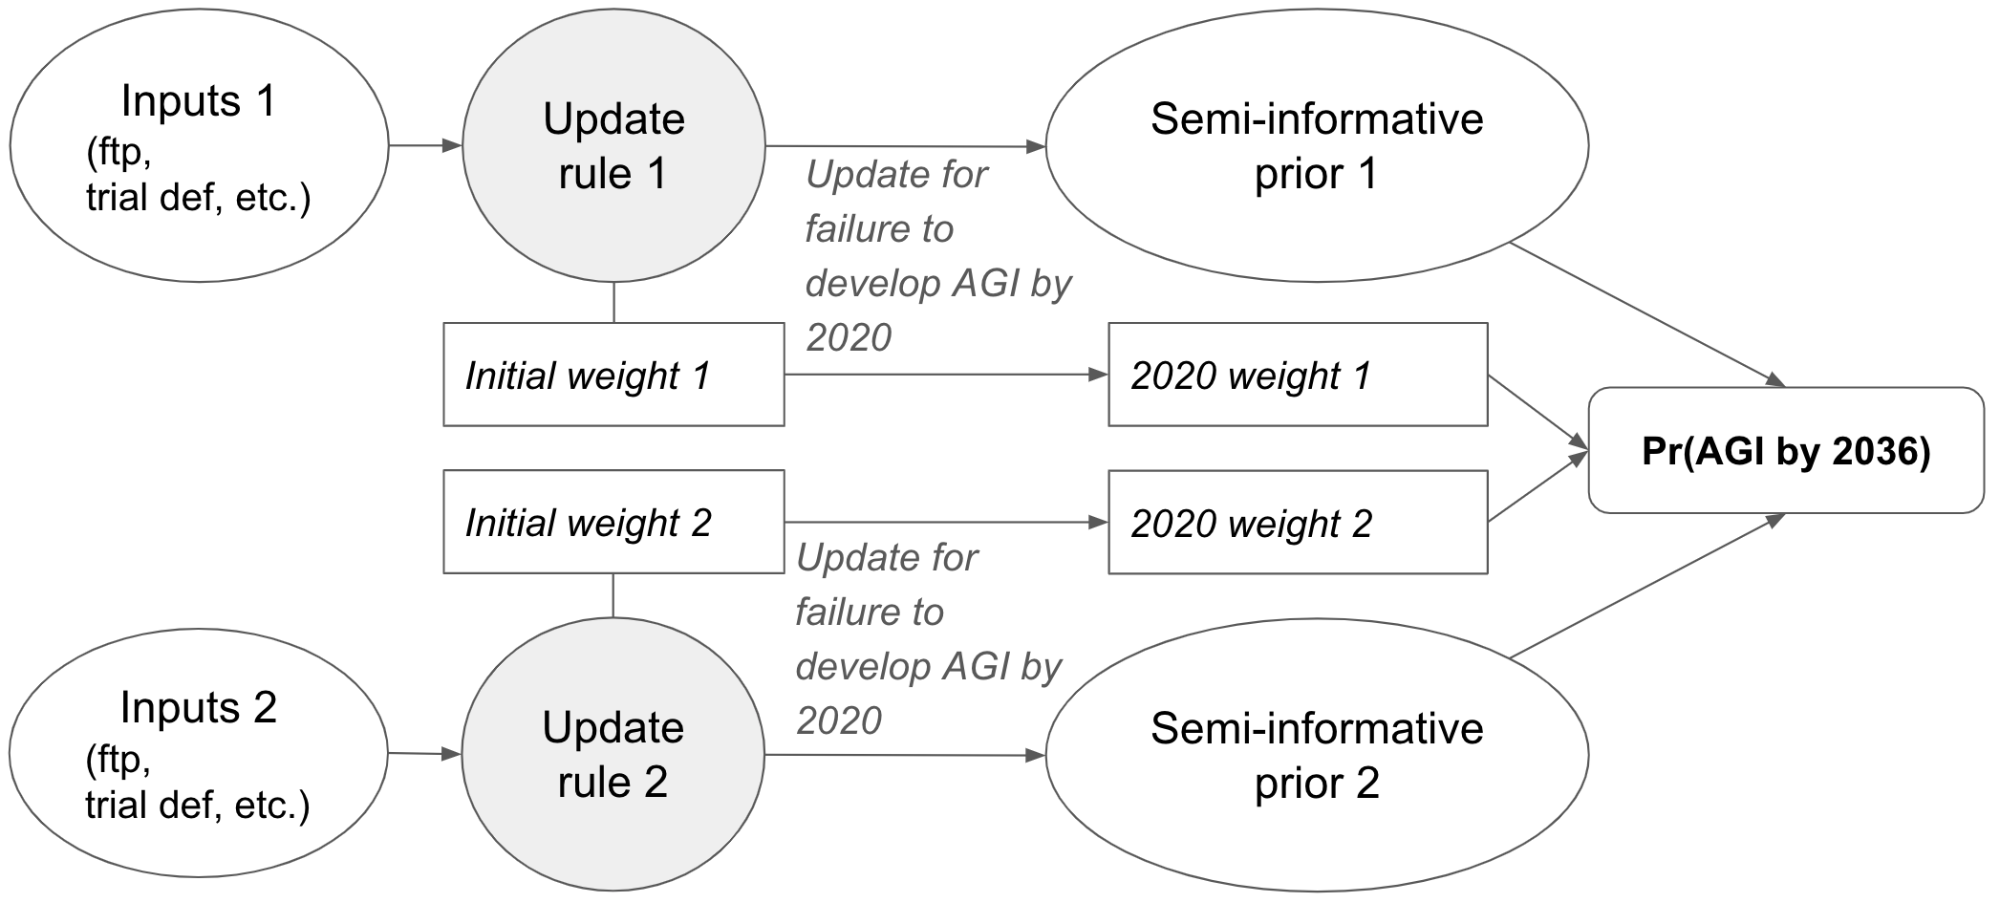
Hyper-priors allow us to take into account a vast range of possible inputs. They also allow us to assign some initial weight to AGI being impossible, which I do when reaching my overall bottom line (more here).
8.8 All things considered pr(AGI by 2036)
I used hyper-priors over multiple update rules to calculate low-end, high-end, and central estimates of pr(AGI by 2036).
The table shows the key inputs to each estimate, and the resultant pr(AGI by 2036).
| LOW-END | CENTRAL | HIGH-END | |
|---|---|---|---|
| First-trial probability (trial = 1 calendar year) | 1/1000 | 1/300 | 1/100 |
| Regime start-time | Early (1956) | 85% on early
15% on late67 |
20% on early
80% on late68 |
| Initial weight on calendar year trials | 50% | 30% | 10% |
| Initial weight on researcher-year trials | 30% | 30% | 40% |
| Initial weight on computation trials | 0% | 30% | 40% |
| Initial weight on AGI being impossible | 20% | 10% | 10% |
| g, growth of researcher-years | 7% | 11% | 16% |
| Maximum computation spend, 2036 | N/A | $1 billion | $100 billion |
| pr(AGI by 2036) | 1% | 8% | 18% |
| pr(AGI by 2100)69 | 5% | 20% | 35% |
The initial weights are set using intuition.
It goes without saying that these numbers depend on highly subjective judgment calls. Nonetheless, I do believe that the low-end and high-end represent reasonable bounds.
I encourage readers to take a few minutes to enter their own preferred inputs in this simple tool, which also shows the assumptions used in the low, central and high estimates in more detail.70 The tool allows you to rule out AGI by a year of your choice, rather than using 2020; I ruled out AGI until the end of 2028 and this roughly halves pr(AGI by 2036), though it makes less difference for longer-term predictions.
9. Strengths and weaknesses of the framework
Before discussing the strengths and weaknesses, it’s worth repeating that the framework does not attempt to reach an all-things-considered view on pr(AGI by year X). Other relevant inputs include estimating when the computation needed to train a human-level AI system will be affordable,71 and the views of machine learning practitioners.72 To arrive at an all-things-considered judgment, I would want to place some weight on each of these factors.
9.1 Strengths:
- Quantifies the size of the update from failure so far. We can compare the initial value of pr(next trial succeeds) with its value in 2020.
- As mentioned above, we find that this update does not justify pr(AGI by 2036) much lower than 5%.
- Highlights the role of intuitive parameters. The report analyses how the inputs and empirical forecasts affect pr(AGI by year X). People can express disagreements about AGI timelines using the framework.
- Arguably appropriate for expressing deep uncertainty about AGI timelines.
- Produces “long-tailed distributions”, reflecting the possibility that AGI will not be developed for a very long time (more here).
- Can express Pareto distributions (more), exponential distributions (more), and uninformative priors as special cases.
- Spreads probability mass fairly evenly over trials.73 For example, it wouldn’t assign a much higher probability to AGI being developed in 2050-2060 than in 2040-2050.
- Avoids claims like “we’re X% of the way to completing AGI”. This is attractive if you believe we are not in a position to make reliable judgments about these things, or if you want to put some weight on an approach that doesn’t take this evidence into account.
- Is relatively simple, with a small number of key parameters that affect the results in intuitive ways.
9.2 Weaknesses:
- Incorporates limited kinds of evidence.
- Excludes evidence relating to how close we are to AGI and how quickly we’re progressing. For some, this is the most important evidence we have.
- Excludes knowledge of an end-point: a time by which we will have probably developed AGI (more here).
- Only includes the binary fact we haven’t developed AGI so far, and outside view evidence used to choose the inputs.
- Near term predictions are too high. Today’s best AI systems are not nearly as capable as AGI, which should decrease our probability that AGI is developed in the next few years. The framework doesn’t take this evidence into account (unless we rule out AGI before a later date than 2020).
- Assumes a constant (unknown) chance of success each trial. This is of course unrealistic; various factors could lead the chance of success to vary from trial to trial.
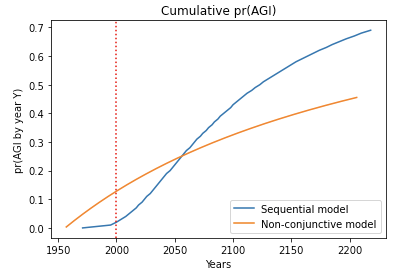
- I analyzed a sequential model in which multiple steps must be completed in order to develop AGI. I compared it to my framework, with the inputs to both chosen in a similar way. After a few decades both models agreed about pr(next trial succeeds) within a factor of 2. This is shown by the similar steepness of the lines.74

The reason for the agreement is that the sequential models are agnostic about how many steps still remain in 2020; for all they know just one step remains! Such agnostic sequential models have similar pr(next trial succeeds) to my framework once enough time has passed that all the steps might have been completed.
- Appendix 12 makes a more general argument that our results are driven by our choice of inputs to the framework, not by the framework itself. In other words, the question of whether the per-trial chance of success is changing is less significant to pr(AGI by year X) than the inputs identified above. (Again, this conclusion is only plausible if we remain agnostic about how far we currently are from developing AGI.)
- However, the argument in Appendix 12 is not conclusive and I only analyzed a few types of sequential model. It is possible that other ways of constructing sequential models, and other approaches to outside view forecasting, would give results that differ more significantly from my framework.
- I analyzed a sequential model in which multiple steps must be completed in order to develop AGI. I compared it to my framework, with the inputs to both chosen in a similar way. After a few decades both models agreed about pr(next trial succeeds) within a factor of 2. This is shown by the similar steepness of the lines.74
10. Links to reviewer responses
The report was reviewed by three academics. Here are links to their reviews, to which I have appended my responses:

