This is the third in a series of posts (intro, deterrence, incapacitation, aftereffects) summarizing the Open Philanthropy review of the evidence on the impacts of incarceration on crime. Read the full report here.
In my deterrence post, I explained why, in my reading, the research says that stiffer sentencing hardly deters crime in this country today.
In this post, I move from the “before” of incarceration to the “during,” what criminologists call “incapacitation.” Does putting more people in prison markedly reduce crime outside prison walls—at least while those people are still in prison? I think that in writing my full report, I approached the research on this question with just as much skepticism as I did with deterrence. Yet the incapacitation research better withstood my scrutiny. I am convinced that decarceration on the scale proponents hope for measurably increases crime in the short run. (It may do the opposite in the long run, by reducing exposure to the potentially criminogenic influences of prison; my next post investigates that possibility.)
I found six studies that met my criterion of exploiting an experiment or a strong natural experiment. One takes place in Italy, one in the Netherlands, and the rest in the United States. I will briefly describe four, and say more about the two U.S. ones whose data and code availability allowed for replication and reanalysis.
Changing sentencing guidelines in Maryland
In 2001, the Maryland State Commission on Criminal Sentencing Policy, which gives judges nonbinding guidance on sentencing, modified a recommendation in a way that caused people of a certain age to be sentenced to significantly less time in prison. In particular, the commission lowered the age at which, when counting prior offenses, judges should stop considering a defendant’s juvenile record. Since judges generally sentence people with more priors to more time, and since the juvenile record age limit fell from 26 to 23 years, 23-25-year-olds with juvenile priors saw those erased from consideration, and received shorter sentences. In a study exploiting this sudden change, Emily Owens calculates that time served for this group fell an average 222 days.
Owens also finds that in their extra days of freedom, the “lucky” defendants were rearrested at an average rate of 2.8 times per year, of which 1.65 were for drug offenses. Since not every crime leads to arrest, that number probably understates the extra crime. Adjusting, Owens estimates that the people in the study committed 2.9 index crimes/year during the time they would, under the old guidelines, have been imprisoned. (Recall from my deterrence post that index crimes are the serious violent and property crimes tracked by the FBI in order to compute the national crime rate.)
That number, 2.9 index crimes/year, is an incapacitation effect—or “reverse incapacitation” in this case, since the guidance update sent fewer people to prison. As we will see, studies in other contexts and populations find more incapacitation.
Prison overcrowding lawsuits against states
Before economist Steven Levitt built the popular “freakonomics” brand, he earned a reputation within his field for coming at old questions from clever new angles in order to garner fresh insights. An early and characteristic work asks whether, within states, higher or lower prison growth caused lower or higher crime growth the next year. Like the David Abrams paper on deterrence in my deterrence post, this study looks across all U.S. states over a range of years (1973–93), aggregating states’ statistical histories in search of a common pattern. The clever insight is that prison overcrowding lawsuits, brought against states by groups such as the ACLU on the argument that overcrowding constituted cruel and unusual punishment, caused arbitrarily timed changes in state prison growth. As the cases proceeded over years, courts took control of state prison systems in order to restrain or reverse prison growth, and later released them from court control, sometimes causing growth spurts.
Levitt’s method for checking how such events affected a state’s crime the next year is too complex to explain here (see my full report). His bottom line says that a person who avoided prison because of a judge’s orders to limit overcrowding committed an average of 1.2 police-reported violent crimes and 6.7 police-reported property crimes in that first year of freedom. (In the FBI’s classification, violent crime totals include, and are dominated by, robbery, which is considered violent because it is a crime against a person. Property crimes include burglary and larceny/theft. The FBI only counts crimes reported to the police.)
In the full review, I voice several technical concerns about Levitt’s analysis, most of which reflect advances in econometric practice in the 21 years since the paper appeared. I address them by reconstructing the study and applying newer methods. I conclude that Levitt is more likely right than wrong: sudden, litigation-spawned slowdowns in prison growth may well have increased crime one year later, while counterpart growth spurts reduced crime. But “more likely right than wrong” is as certain as I can get. For when I apply more conservative methods that combat potential sources of bias and false precision, the margins of error on the impact estimates greatly widen.
Targeting prolific offenders in the Netherlands
Starting in 2001, the Netherlands rolled out a policy allowing judges to sentence the most prolific criminals to much more time—say, two years instead of two months. The statistics of this select group of prolific offenders are remarkable. According to one survey, they admitted committing an average of 256 crimes per year, in order to earn 50–100 euros/day to support a drug habit. They had been convicted 31 times before on average, and a few had passed 300. Even before the new policy, they spent an average of four months in jail each year.
Dutch authorities implemented the new regime first on a pilot basis, in 10 cities with many prolific offenders. They deferred the national rollout until after 2004. To measure how the targeted program affected crime overall, Ben Vollaard collected monthly data for the 10 cities in the first wave, plus an additional 21 second-wave cities. His core results are captured in a pair of graphs, which show crime rates in the two waves of cities in the Netherlands–the first graph for theft, and the second for certain violent crimes:
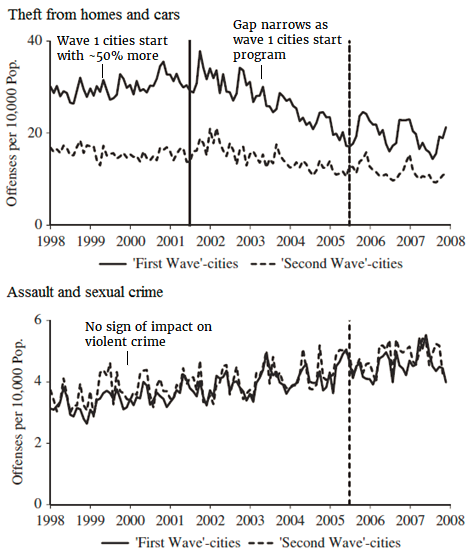
Before the law went into effect in the 10 first-wave cities in 2001, they had about 50% more crime than the 21 second-wave cities. After, it appears, crime fell in both groups, but more so in the first-wave cities. The data hint that the gap stopped narrowing after the law went into effect in the second-wave cities. As for violent crimes, no differences appear anywhere along the time span.
Since the pilot cities were not chosen arbitrarily, this quasi-experiment is one of the weaker in my review. Still, the results seem plausible. Vollaard finds that 3.66 acquisitive crimes per month were prevented for each person imprisoned under the law, which looks modest compared to the self-reports of 256 crimes/year that I just cited, but is far more than Owens found in Maryland and Levitt found across U.S. states. Overall, the Dutch law appears to have reduced crime by a remarkable 25% by 2007. However, Vollaard finds that as a city imprisoned more of its prolific offenders, the incapacitation benefit slowed, pointing to diminishing returns. This suggests that the American system of mass incarceration—opposed in philosophy to the targeted Dutch program—can be expected to reduce crime much less through incapacitation.[1]
Back to the amnesty in Italy
In the deterrence post, I recounted how the Italian government once released 36% of its prisoners virtually overnight. I described a study that tracked individual releasees over the following seven months and demonstrated that people who had had more prison time suspended were less likely to wind up back in prison. The “before” effect of incarceration, deterrence, could explain that, since those suspended sentences could be reinstated for people who were convicted of new crimes. So could the “after” effects, since people with more time suspended generally had spent less time in the crowded and inhumane conditions that so stirred the Pope.
Thinking about those cross-prisoner differences and the theories to explain them takes some furrowing of the brow. We can instead pose a straightforward question about the great Italian amnesty: did crime go up or down right after all those people were freed? That speaks most to the during effect of incarceration, which is incapacitation.
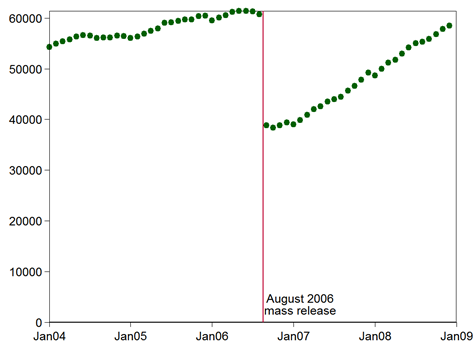
Paolo Buonanno and Steven Raphael bring that question to the data—and produce an incontrovertible answer. The first graph below is adapted from their paper, using their public data set. It shows the number of prisoners in Italy by month, 2004–08. Italy’s prisons partially emptied and then refilled (or re-overfilled) within a few years:
The next graphs show the number of crimes in Italy by type and month, 2004–08 (seasonally adjusted):
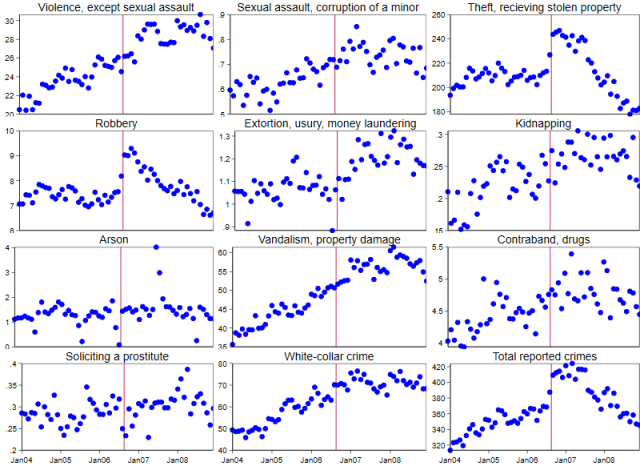
The plots for the robbery and theft look like the prisoner graph upside-down: they hold steady till the great release, then jump up, then slide down. And because thefts are most common, their pattern drives the crime total (bottom right). Clearly, the amnesty increased crime. Crunching the numbers, it seems that right after release ex-prisoners committed an average 1.5 crimes per month (counting ones reported to the police). Perhaps, as in the Netherlands, a minority of the people committed a majority of the offenses.
In fact, while the prisoner count merely returned to its pre-amnesty level, the robbery and theft rates ended below where they started. Why would that happen? Buonanno and Raphael hypothesize that the released prisoners had less criminal propensity than those who replaced them, perhaps by virtue of being older (nearly 39 on average). Criminality declines with age after about 20 (see section 2.4.1 of the full report). Or maybe the releasees offended less once freed because prison had rehabilitated some of them.[2]
Rather as with the Dutch study, the major caveat for an American reader is that Italy imprisons a much narrower slice of its population than the U.S. does: one per thousand just before the release, compared to seven per thousand in the U.S.[3] If mass incarceration has ensnared people with less and less criminal propensity, then at the margin America’s incapacitation effect has probably diminished. Indeed, the Italian incapacitation effect, at 1.5 crimes/month, well exceeds what the American studies return.
Back to Florida youth
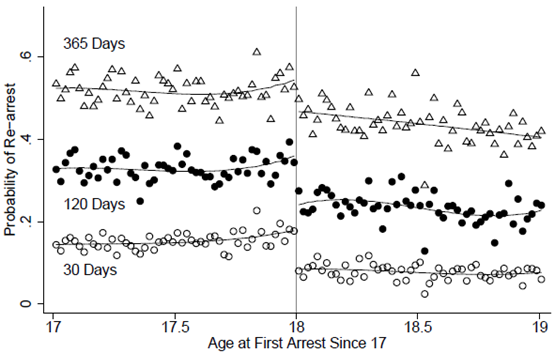
Remember that the deterrence post also drew on research from Florida. David Lee and Justin McCrary showed that turning 18 did not deter young people from getting arrested less, as it were, even though reaching this milestone put them under the adult-level sentencing regime. Having answered the question about deterrence, Lee and McCrary turn to incapacitation. Compare young people who were arrested a week before they turned 18 to those who were arrested a week after: in the following months, who gets rearrested more?
Lee and McCrary show that those arrested just before turning 18 got rearrested more in the following months. Evidently those arrested just after 18 were tried as adults and put in jail or prison, so they couldn’t get rearrested for a while. And that is incapacitation. The pattern manifests as distinct drops at age 18 in this graph of the probability of second arrest within 30, 120, or 365 days of first, as a function of age of first post-17 arrest, Florida, 1989-2002:
Decarceration in California
California’s criminal justice pendulum has reversed. Where voters ratified Three Strikes in 1994[4], in 2012 they approved Proposition 36, which scaled back the same law.
And the year before, what was essentially an overcrowding lawsuit drove the legislature to enact reforms to shrink the prison population. Among other things, the new “public safety realignment” grants judges more freedom to apply sanctions other than incarceration, and moves inmates convicted of non-serious, non-sexual, nonviolent offenses from prisons to jails, where they can more quickly earn credit toward early release.
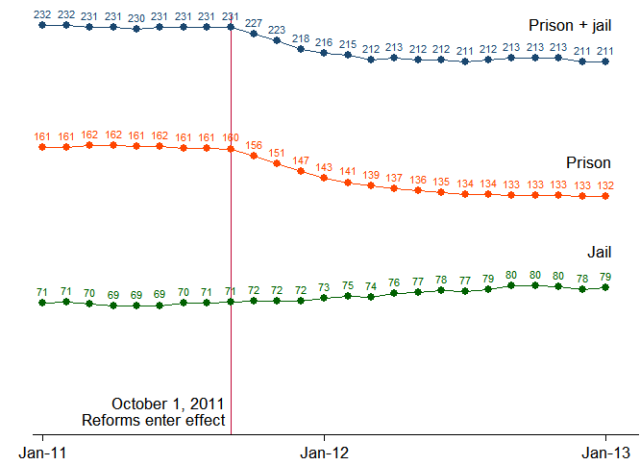
California’s prison population started shrinking as soon as “realignment” went into effect on October 1, 2011. However, the incarcerated total fell less because more people went to jail, as seen in this graph of thousands of inmates, by month, in California, January 2011–January 2013: [i]
Around the time of the reform, crime began rising in California, as shown in this graph of property and violent crimes (excluding rape) by month, California, seasonally adjusted, 2000–14:
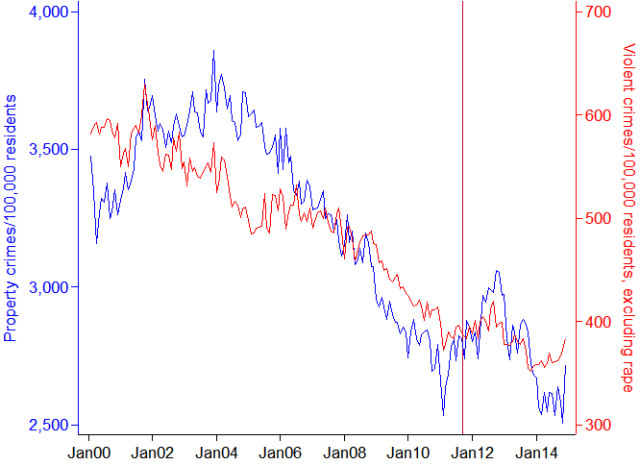
The climb reversed in 2013–14, but property crime arguably stayed above the trend of the 2000’s.[5]
Vexingly, while the Italy data fairly shout that decarceration increased crime in the short run, the California data whisper through static. The graph just above suggests that crime began to increase there before realignment. Or possibly the pre-realignment rise is a mix of statistical noise and optical illusion produced by anomalously low numbers for February 2011. At any rate, because California’s decarceration was smaller and slower, the data have less power to detect its consequences.
The paper that inspired my graphs is by Steven Raphael, who coauthored the Italy study, and Magnus Lofstrom. Perhaps because the data speak less clearly here, the authors use more complicated methods in their attempt to statistically isolate the impact of interest. One is called synthetic control. The idea is to benchmark California’s crime trend against those of others states, averaged together. The computer chooses a weighted blend—say, 32% Wyoming, 17% Arizona, etc.—that best matches California’s crime numbers in the years before realignment. Then, if crime rate in this “synthetic California” diverges from that in the real California after realignment, we can attribute the gap to realignment itself. Lofstrom and Raphael conclude that realignment did not increase violent crime in the years just after reform, but did increase property crime, most certainly motor vehicle thefts, at a rate of 1.2 reported thefts per person-year of reduced incarceration.
However, in my reconstruction of this study, synthetic California proved unstable: small changes in how I had my computer fabricate it led to big changes in the apparent impact of realignment. Peering inside this algorithmic black box, I found that crime also began rising in Nevada right after California’s “public safety realignment”:
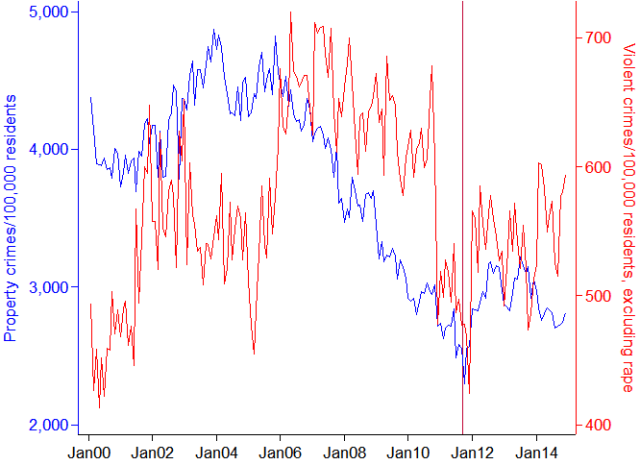
So when Nevada was a major ingredient in my synthetic California, then, by comparison, crime hardly rose in California. That raised a question: is Nevada a good benchmark for California? Arguably it is, as a neighbor that did not “realign.” Perhaps some force was driving crime across the region, such as an economic downturn or a drug epidemic, and it fueled the post-2011 crime rise in both states. If so, then benchmarking California against Nevada helps control for that factor.
On the other hand, California’s realignment may have caused Nevada’s crime rise as people who would have been imprisoned crossed the border and committed offenses in Nevada. That would taint Nevada as a control. Unfortunately, this ambiguity, like that over the timing of California’s crime rise, looks irreducible: sophisticated econometric analysis is more likely to obscure it than resolve it.
My best guess is that realignment did increase crime in California in the short-term. Why? Lofstrom and Raphael get about the same answer from a quite different analysis. Instead of benchmarking California against other states, this one looks within California, at whether counties that cut their inmate populations more experienced bigger crime increases. I view this as a weaker experiment since the county-by-county inmate reductions were hardly random. But that it comes to the same answer, the strongest result being about 1.2 reported motor vehicle thefts per person-year, looks like more than a coincidence.
And I think it is conservative—uncomfortable—for Open Philanthropy to interpret California’s short-term property crime increase as a consequence of realignment.
Summary
All six incapacitation studies that met my quality criteria conclude that, on average, people who by luck avoid prison or get freed early commit detectable amounts of extra crime.
For my cost-benefit analysis, I decided to use results from Lofstrom and Raphael on California’s realignment to proxy for incapacitation at today’s policy margins. Actually, I use my version of their estimates, as explained in the full review: each person-year of averted incarceration causes essentially no change in violent crime but leads in the short run to 1.5 burglaries, 1.2 motor vehicle thefts, and 4.0 other thefts.
For proponents of decarceration, that sounds pretty damning. But consider this. By cutting the time Californians spend in prison, the state is cutting the time they spend building relationships with other convicted offenders, even joining gangs; the time they spend trading tricks for robbing homes; the time they spend unable to integrate into the formal work economy; and the time they spend wondering why, if the system doesn’t give a damn about them, they should give a damn about it. In other words, perhaps by reducing time, realignment is reducing the criminogenic aftereffects of incarceration. If so, realignment may be raising crime in the short-term but is lowering it over the long run.
Or that optimism could be wrong. By sending fewer people to prison, realignment may be depriving them of job training, drug treatment, or other experiences that help them escape criminality long term. Then, realignment would be increasing crime both during the time people would have been in prison and in the time after they would have been released.
Either way the questions must be brought to the data. Unfortunately, slowly emerging, long-run impacts don’t pop out of graphs the way sudden, short-term ones do. But researchers have found ways around this barrier. The next post reviews high-quality studies that measure aftereffects of incarceration.
Code and data for all replications are here (800 MB, right-click and select “save link as”). The cost-benefit spreadsheet is here.
Notes
[1] Vollaard states that the program incarcerated 1,400 people, representing 5% of all prisoners, which implies a Dutch national incarceration rate of about 0.2%.
[2] Another explanation could be the deterrence studied by Drago, Galbiati, and Vertova (reviewed in the deterrence post). But probably that does not suffice. Buonanno and Raphael extrapolate from Drago, Galbiati, and Vertova’s numbers that deterrence depressed releasees’ criminality by 16%. That falls far short of the 60% crime reduction for mass-releasees, relative to their replacements, found by Buonanno and Raphael.
[3] Italy had 58.7 million people in 2006 and 60,710 prisoners just before the mass release (Buonanno and Raphael public data). The US had 322.7 million people at the end of 2015, 2.2 million of them in prison.
[4] So great was the momentum for Three Strikes that even as a measure to enact it was placed on the ballot, the legislature and governor approved a law to do the same.
[5] The violent crime totals exclude rape because the FBI broadened its definition of rape in 2013 and the monthly data do not contain consistent series under either the old or the new definition.
